Dashboards and Analytics
IXOPAY Payments Intelligence empowers businesses with complete visibility into their payment ecosystems. By leveraging no-code integrations and advanced monitoring tools, companies can track transaction flows, identify bottlenecks, and uncover anomalies in real time. This ensures optimized performance, reduced downtime, and data-driven insights to stay ahead in the dynamic payments landscape.
Dashboards give you a live, single-screen view of your payment performance. Monitor authorizations, sales, refunds, chargebacks, declines and fees, spot bottlenecks and anomalies early, and build the view that matters to your team.
Dashboards are now fully widget-based and editable. Use Edit dashboard to build, save and switch between your own dashboards, and compare any period against a previous one.
The following structure is applied for the out-of-the-box KPI configurations:
Analytics section structure
| Tab | Description |
|---|---|
| Main Dashboard | The main summary dashboard provides a quick snapshot of overall performance with key KPIs displayed prominently after logging in. This offers an at-a-glance view of your payment ecosystem. |
| Events | Comprehensive KPIs across all ingested event types for a holistic view of transaction data. Events here will include extra operations such as Tokenization, cancellations, redirects and payment method specific operations. |
| Authorizations | KPIs organized and filtered by authorization transaction types, allowing for in-depth analysis of conversion rates and authorization performance metrics to drive data-driven decisions. |
| Decline Analysis | Focused insights into declined transactions, enabling users to filter and analyze declines effectively. Gain a deeper understanding of the reasons behind failed transactions to mitigate declines and improve customer experience. |
| Sales & Refunds | Display all your KPIs derived from sales and refund events, providing clear visibility into revenue performance, refund trends, and their impact on overall financial health. |
| Chargebacks | Specialized analysis of disputes by chargeback lifecycle, status, payment method, reason codes countries and much more to uncover patterns and reduce risk. |
| Fees | Analyze the impact of costs on your overall payment setup, including detailed cost allocation at the transactional level. Gain insights into blended vs. interchange++ pricing models to optimize your cost structure and maximize profitability. |
| 3D Secure | Monitoring of 3DS (3D Secure) authentication rates, SCA Challenge Rates, Exceptions and much more. |
| VAMP | Dedicated monitoring for the Visa Acquiring Monitoring Program to track compliance and merchant performance metrics. |
| Decline Retry Analysis | Chain analysis of retries after first decline within a 7 day period. Gain insights into how your retry policy behaves on a customer-level (i.e. a customer identified by IXOPAY whose transaction was routed through same PSP or across your PSPs) |
Headers
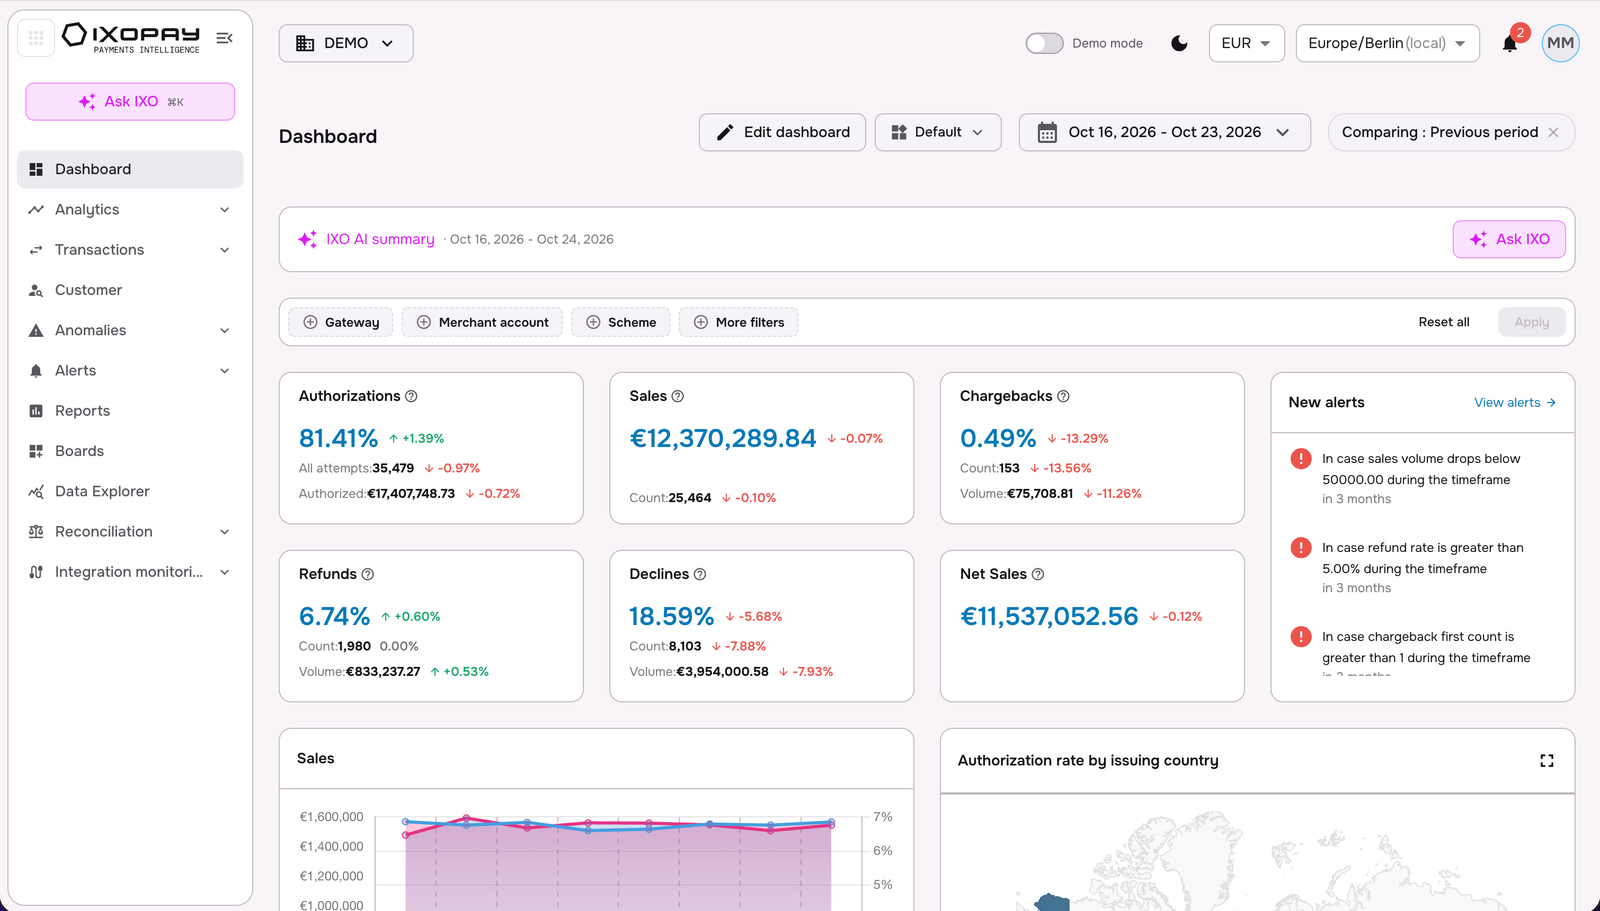
Dashboards are designed to provide a clear and intuitive overview of key performance metrics.
At the top of each dashboard, you'll find header boxes that display the main KPIs for the selected time period. These KPI values serve as a snapshot of performance, allowing users to quickly gauge important metrics.
What's unique about IXOPAY Payments Intelligence's structure is that these header boxes are dynamic, they automatically update based on the section selected, ensuring that the data aligns with the focus of the dashboard at that moment. This makes it easier for users to drill down into specific areas while maintaining visibility on the most relevant performance indicators.
You will also see the following controls on the dashboard:
- Edit dashboard: customize the current dashboard (see Edit dashboard).
- View selector (e.g. Default): switch dashboards, open All dashboards, or Create new dashboard.
- Date range, and Comparison time-period, selector (see Time selection).
- Ask IXO: opens the IXO AI chat interface where you can explore your payments data, analyse trends and get recommendations about your payments operations.
- IXO AI summary: an IXO AI summary of performance for the selected period, which can be further explored with an Ask IXO shortcut to dig deeper.
- Global controls: demo mode toggle, currency (e.g. EUR), timezone and notifications.
Edit dashboard
Edit dashboard turns the page into a canvas you control. Put the KPIs, charts and breakdowns your team cares about front and centre, remove unnecessary noise, and save the result as a dashboard of its own. Build one for Finance, one for Risk, one for Operations, and switch between them in a click.
What you can do
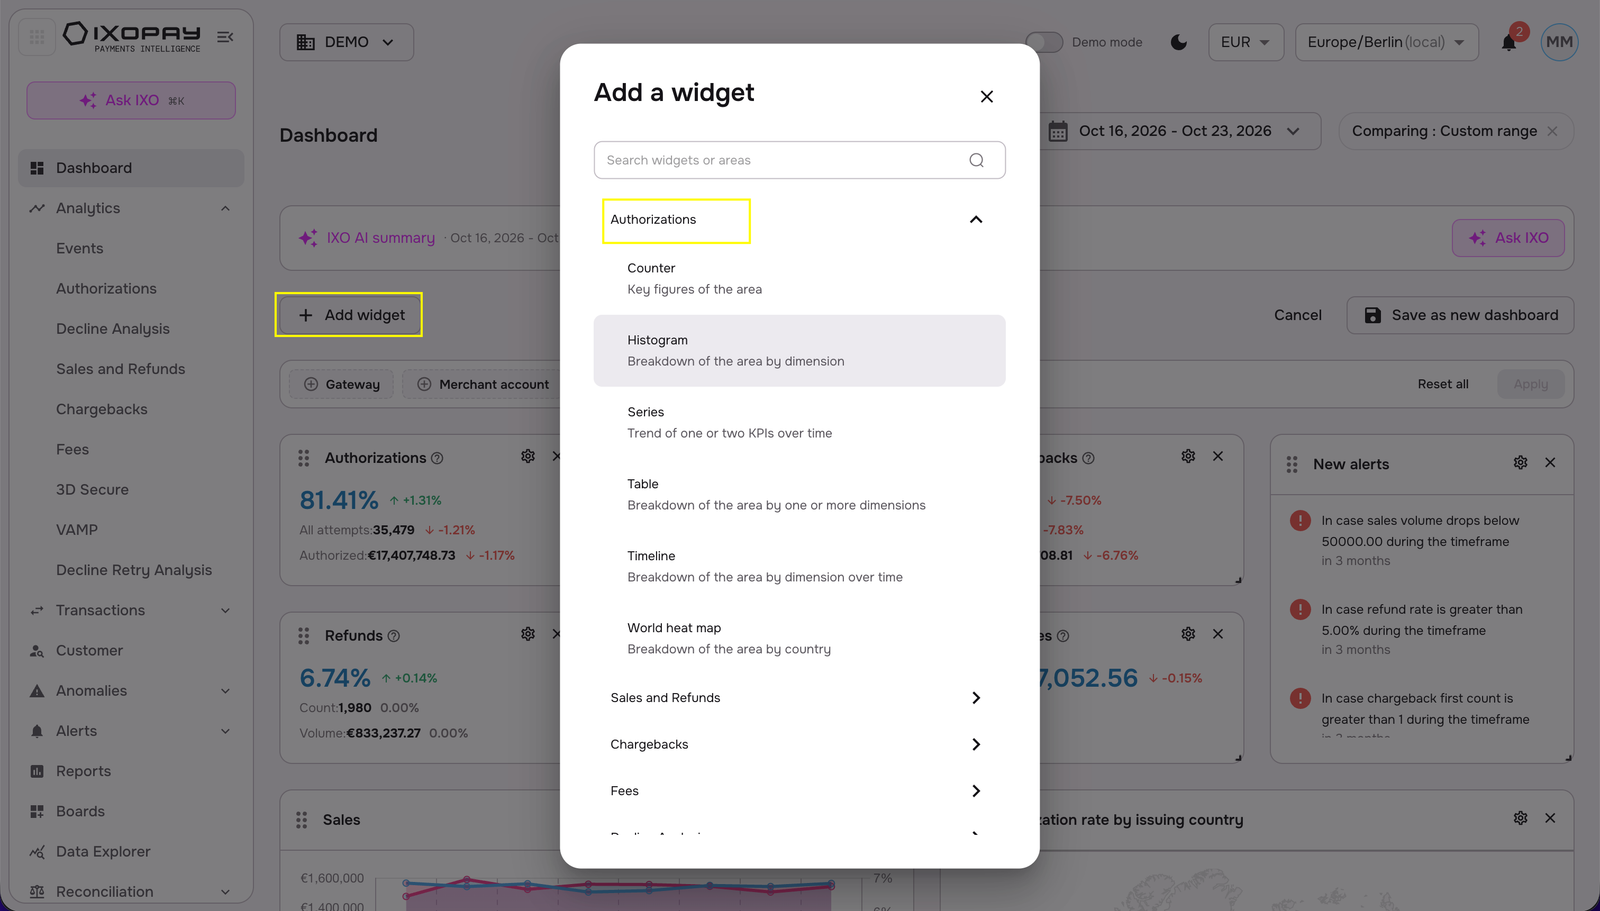
- Add widgets from the full library: Select Add widget and browse by area: Authorizations, Sales and Refunds, Chargebacks, Fees, Decline Analysis, Events, 3D Secure, VAMP, Decline Retry Analysis, and Others. Use the search box to jump straight to the widget you need.
- Drag, drop and resize: Grab the handle on any widget to move it, and resize it to give your most important metrics the space they deserve (you can widen the browser window to move or resize).
- Tailor every widget: Click the 'gear' icon on a widget to open the Analytics Widget Configurator. Rename it, choose the KPI it measures, and pick the date reference (Creation date or Booking date). A live preview updates as you go.
- Remove widgets: Click ✕ on a widget to take it off the dashboard.
- Save as your own: Select Save as new dashboard, name it, and it's instantly available in the view selector as a New Dashboard, or click on Cancel to return everything to how it was.
- Share your dashboards: Any saved dashboard can be shared with your team (i.e. Authorized Users on the IXOPAY portal) to ensure your team has monitoring consistency.
How to build your own dashboard
-
Open the Dashboard page and click Edit dashboard.
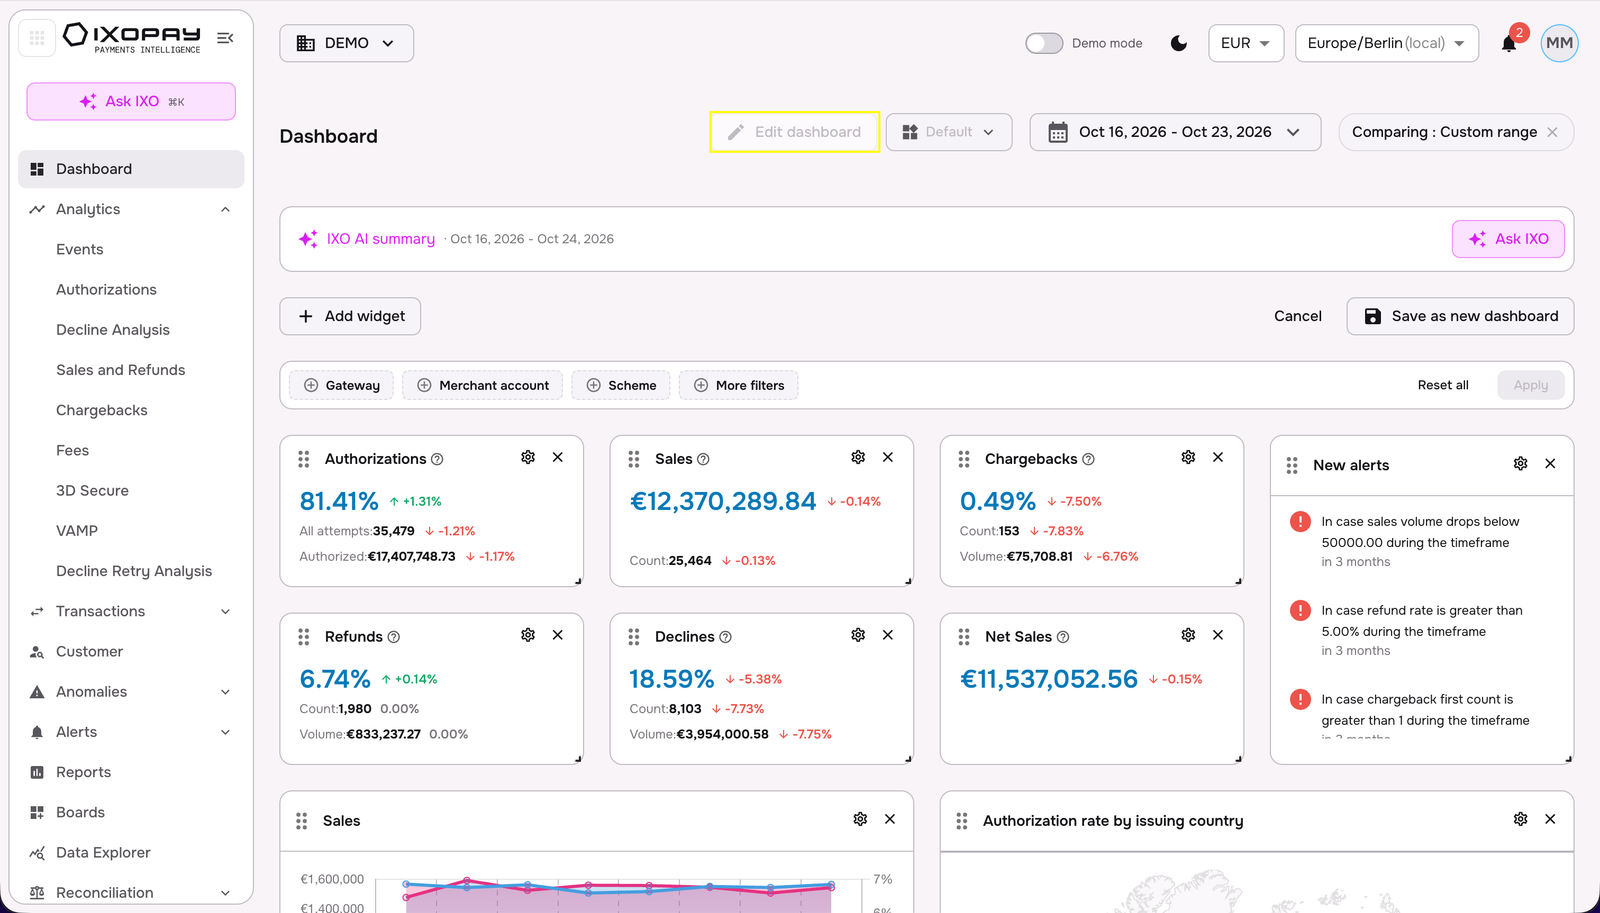
-
Click Add widget, choose an area, select a widget type (e.g. Histogram, key figures of the area), and set its title, KPI (e.g. Authorization), dimensions/ metrics (e.g. Payment Method) and date in the configurator. Drag it onto the dashboard once done.
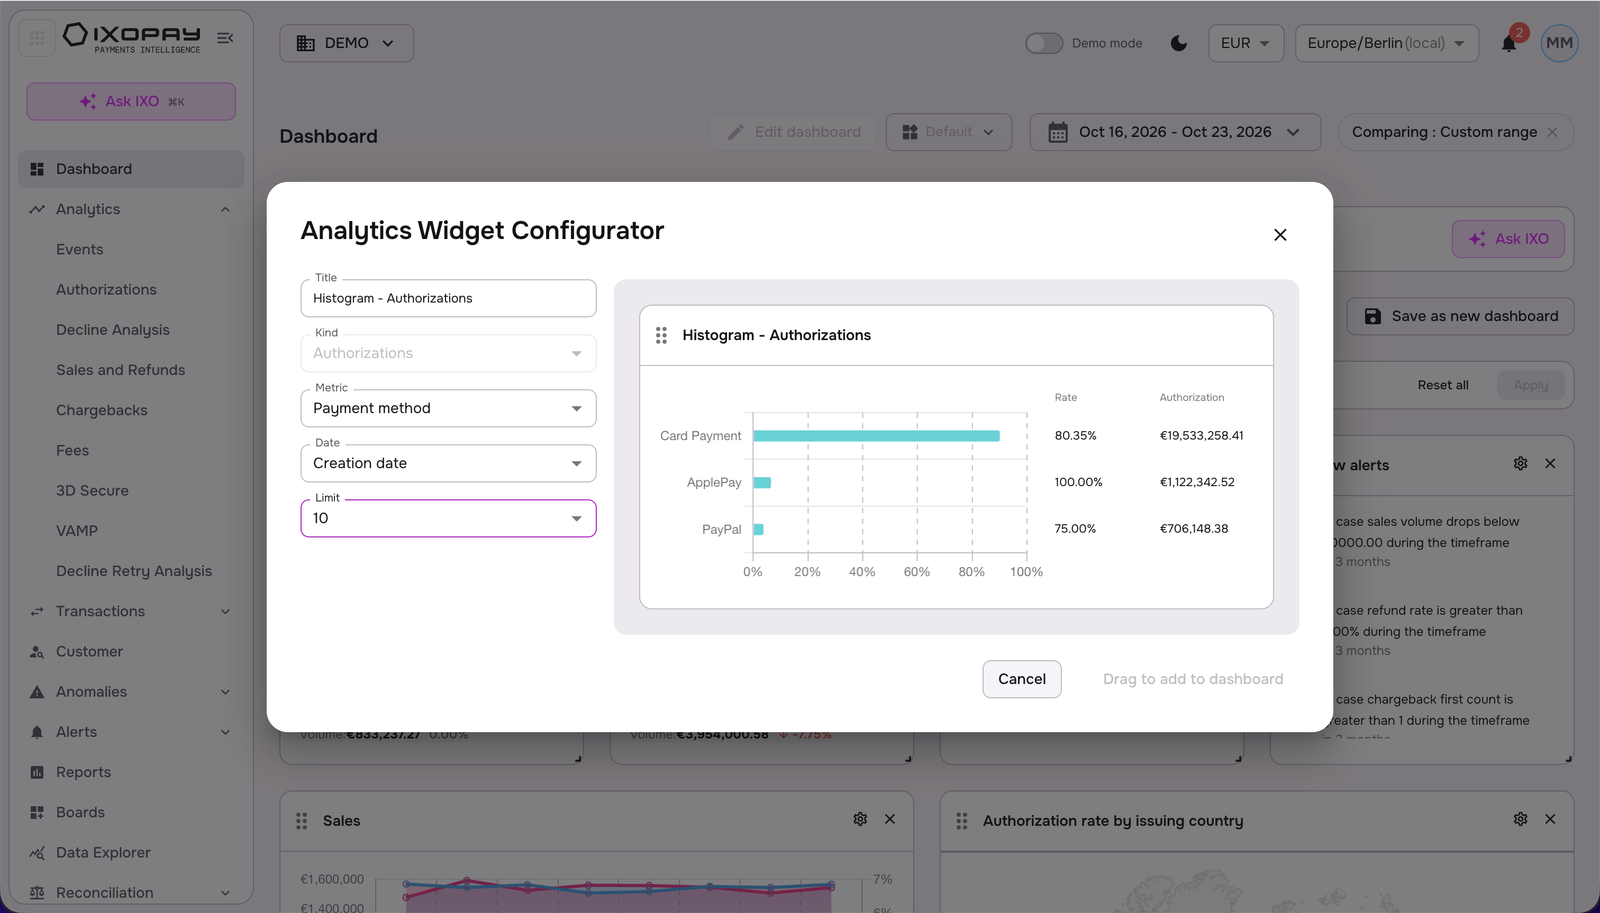
-
Rearrange and resize widgets, and use the gear icon to fine-tune existing ones.
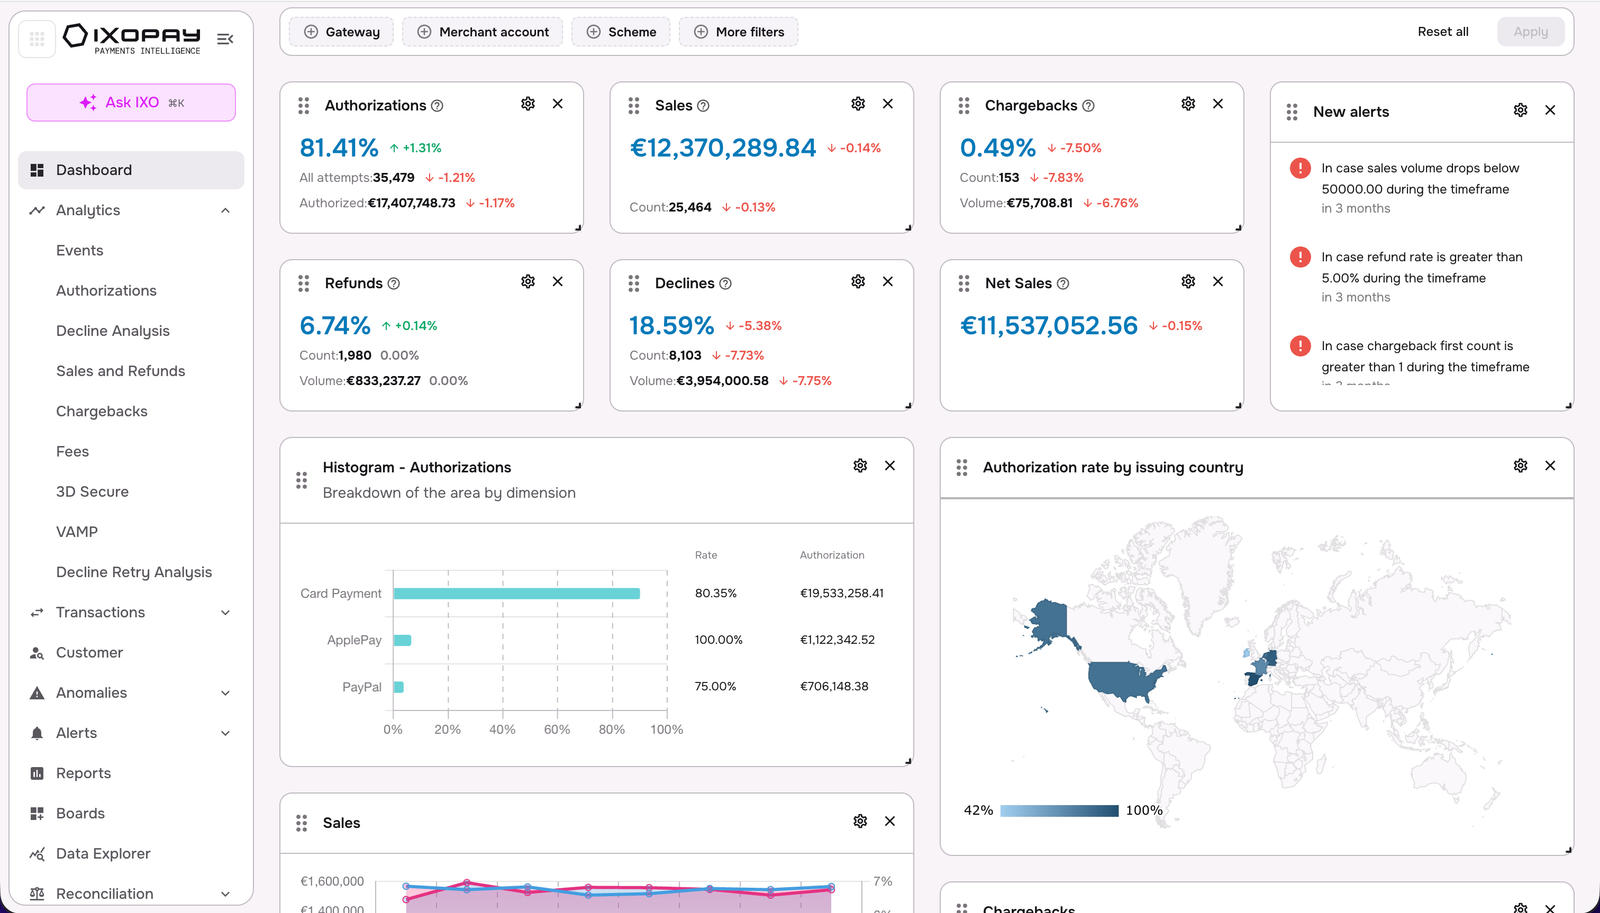
-
Click Save as new dashboard, name it, and confirm.
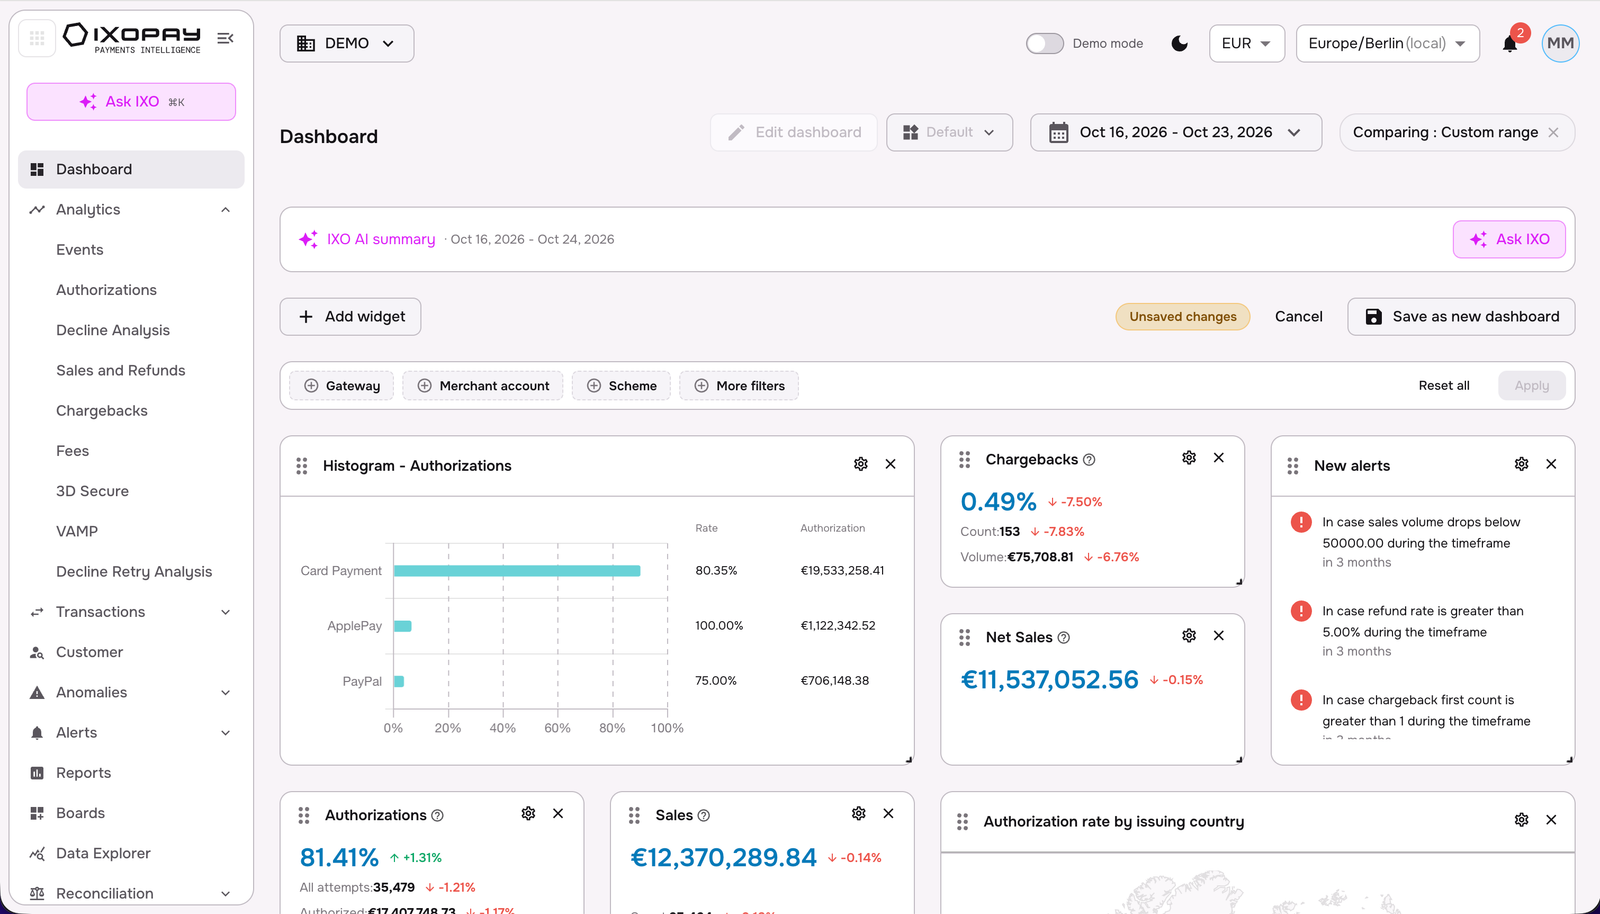
-
Switch dashboards anytime from the view selector, or manage them from All dashboards.
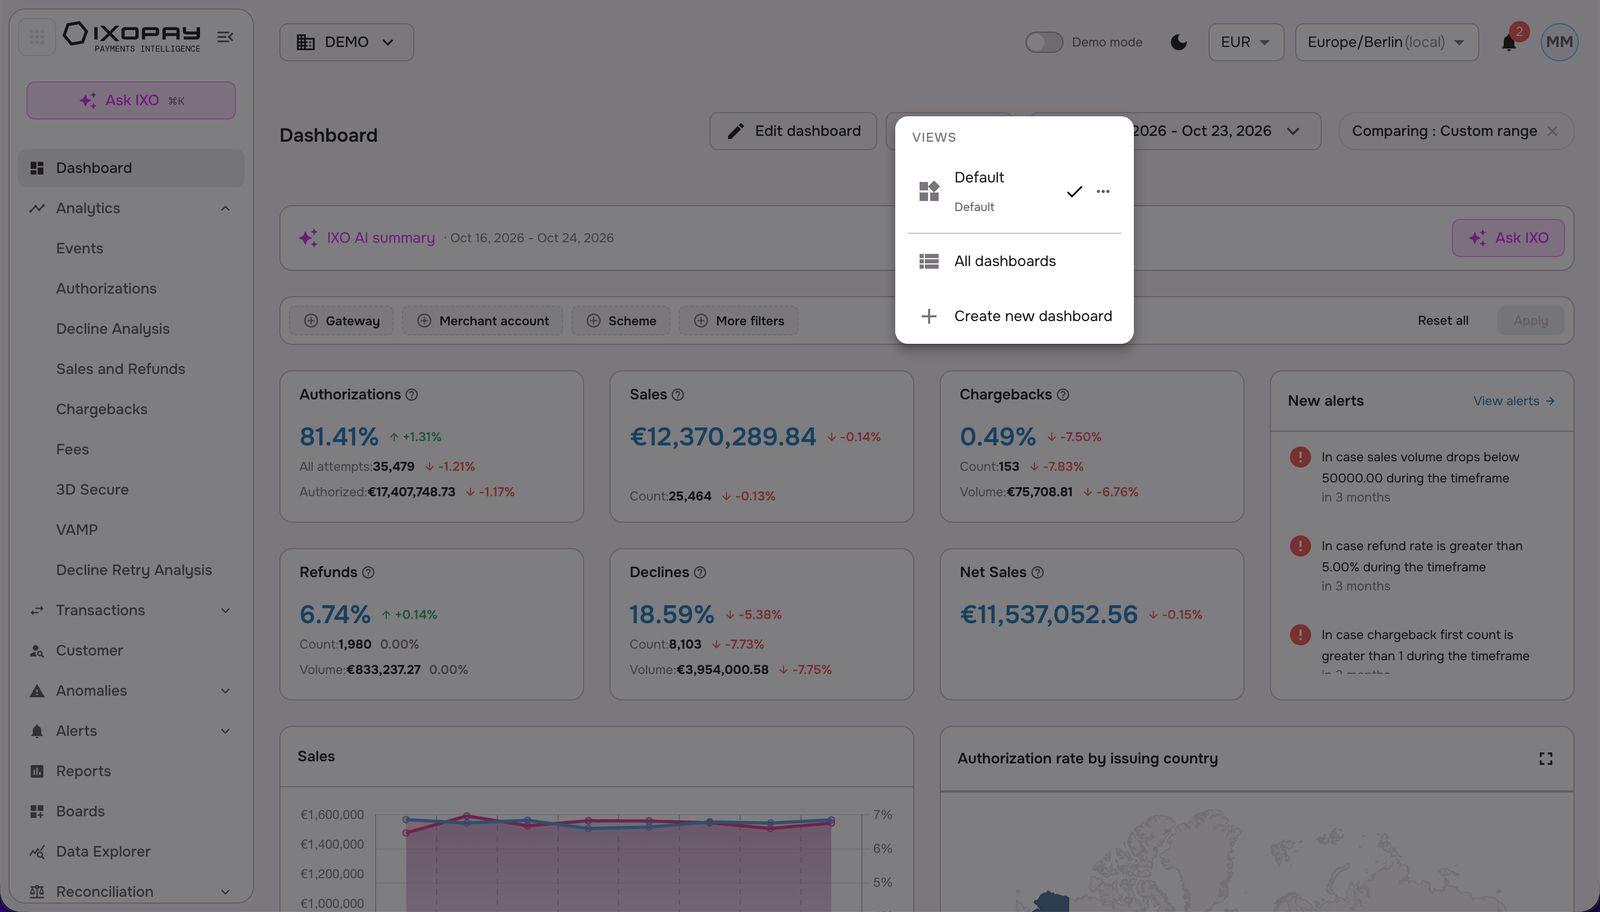
Dashboard views
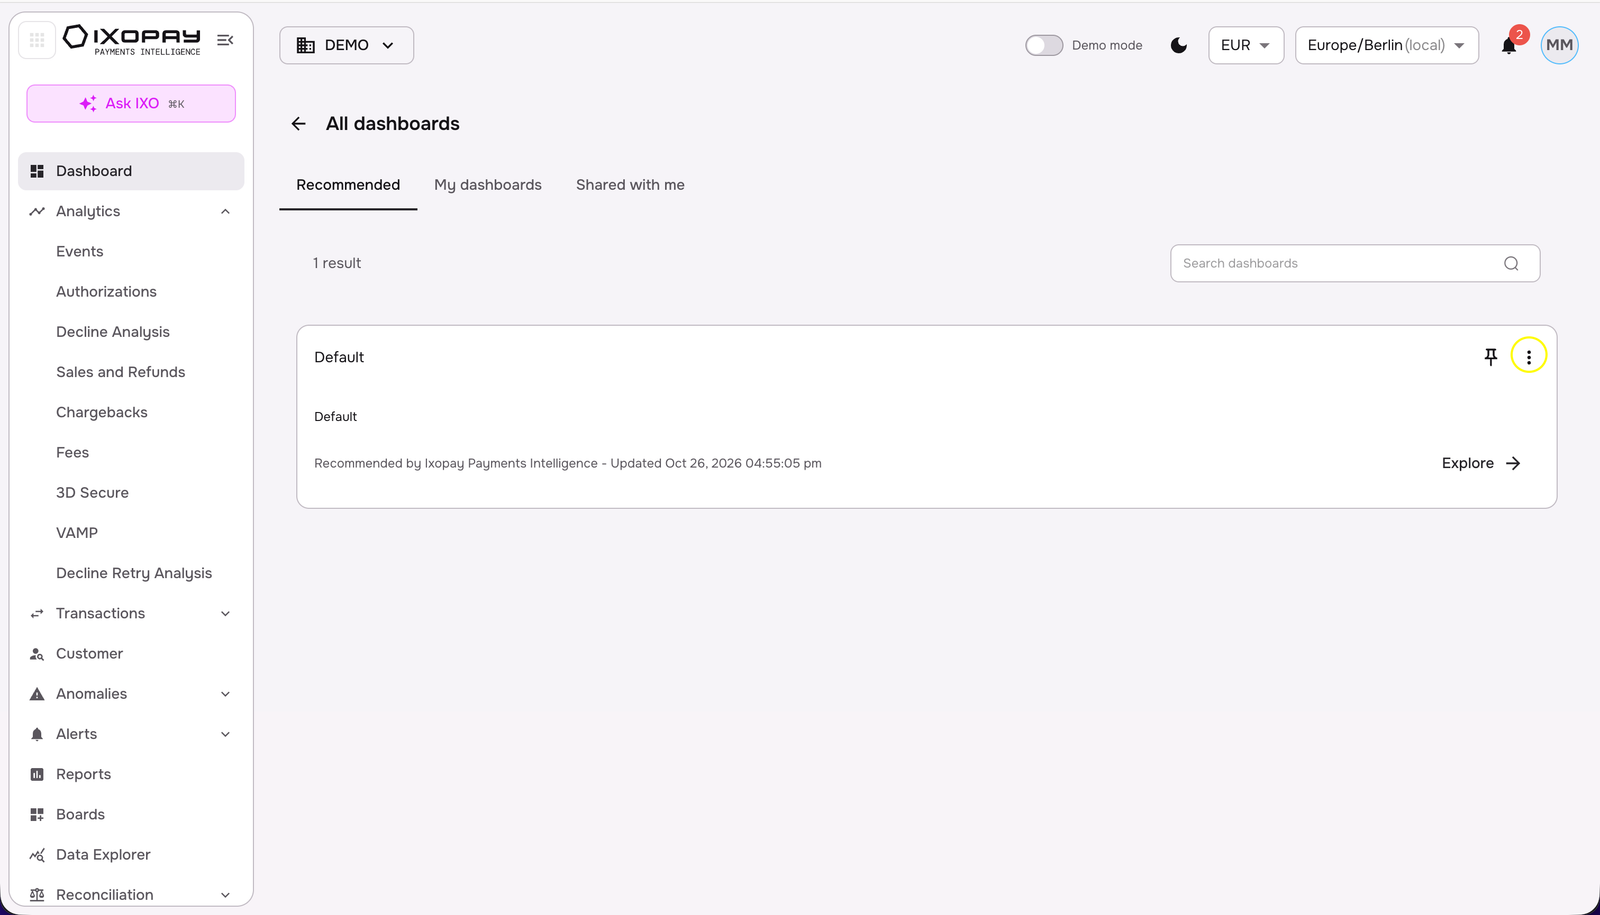
Use the view selector next to Edit dashboard to manage your dashboards:
- Switch between saved dashboards (the active one is ticked; Default is the standard view).
- Open All dashboards to see and manage everything in one list.
- Select Create new dashboard to start a fresh one.
- Use the ⋯ menu on a dashboard for further options.
Time selection
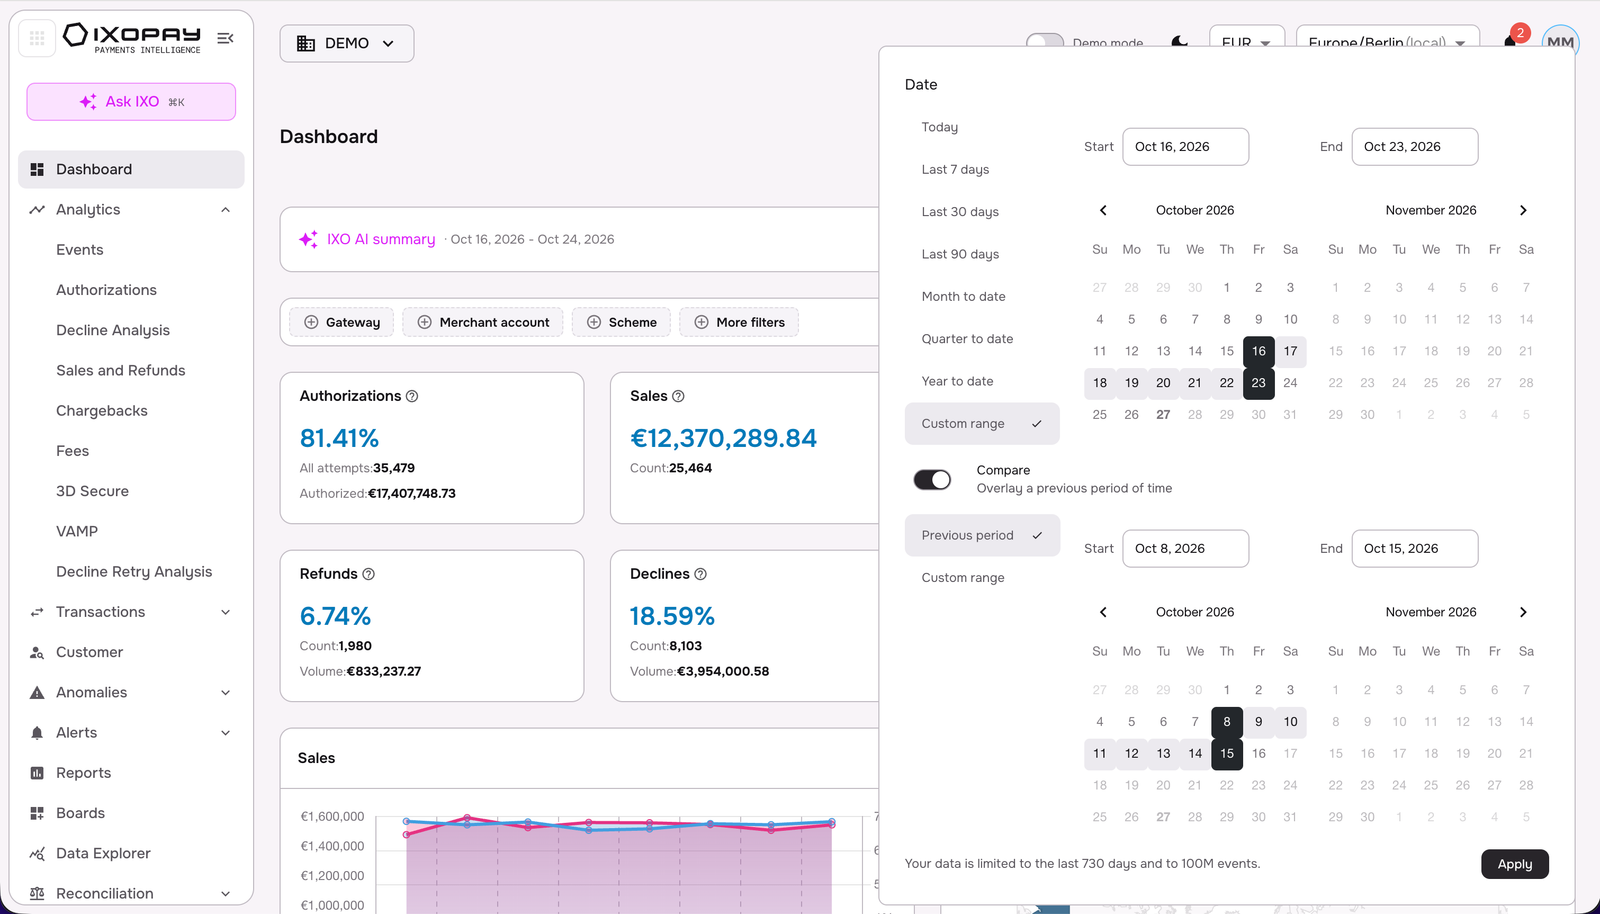
The time selector in the dashboards provides users with the flexibility to adjust the timeframe for their data analysis. IXOPAY Payments Intelligence considers two key date points to ensure accuracy: the creation date of an event, which marks when the event itself occurred, and the booking date, which reflects when the financial impact was realized. This dual approach allows for a more precise understanding of the data.
By default, all data is normalized and harmonized to UTC to maintain consistency across regions. IXOPAY Payments Intelligence also offers users the ability to select their preferred timezone, ensuring data is viewed in a context that makes the most sense for their location and needs. This customization ensures a more personalized and relevant experience for each user.
Filters
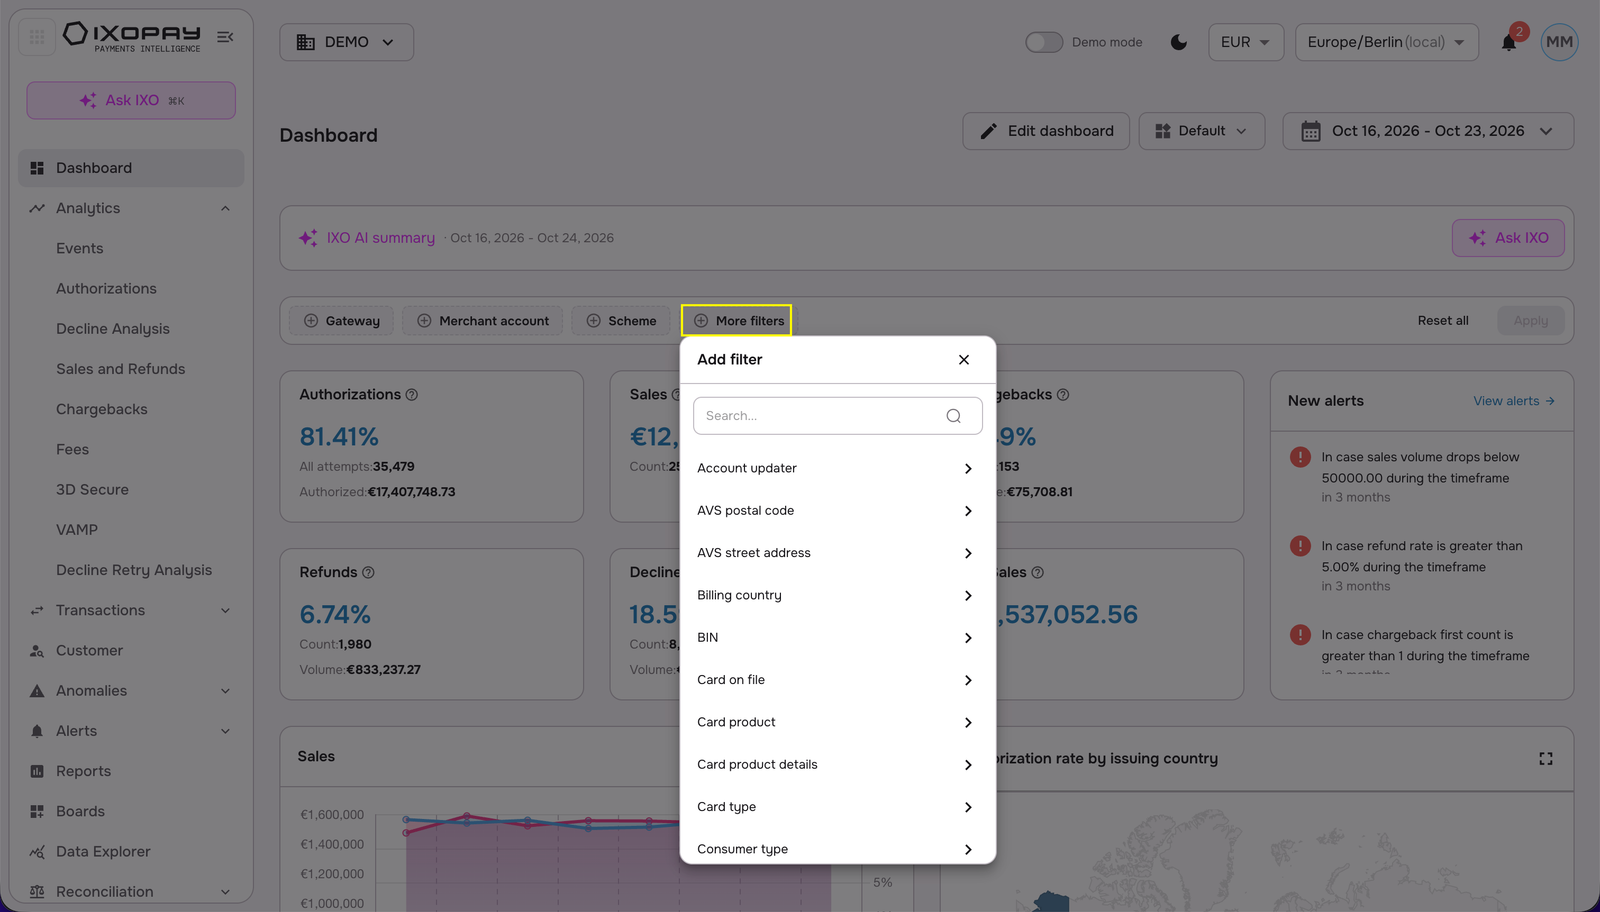
Dashboards provide the ability to apply filters across all dimensions displayed, offering users a powerful way to narrow down and analyze specific patterns within the data. These filters can be used to focus on particular subsets of information, making it easier to spot trends, compare performance, or drill down into specific metrics.
Users can apply overarching filters that affect the entire dashboard, adjusting the displayed data based on broader criteria. Alternatively, for more detailed analysis, users can apply filters directly within dedicated table views. This flexibility allows for both high-level and granular data exploration, catering to a variety of analytical needs.
View customization in Analytics
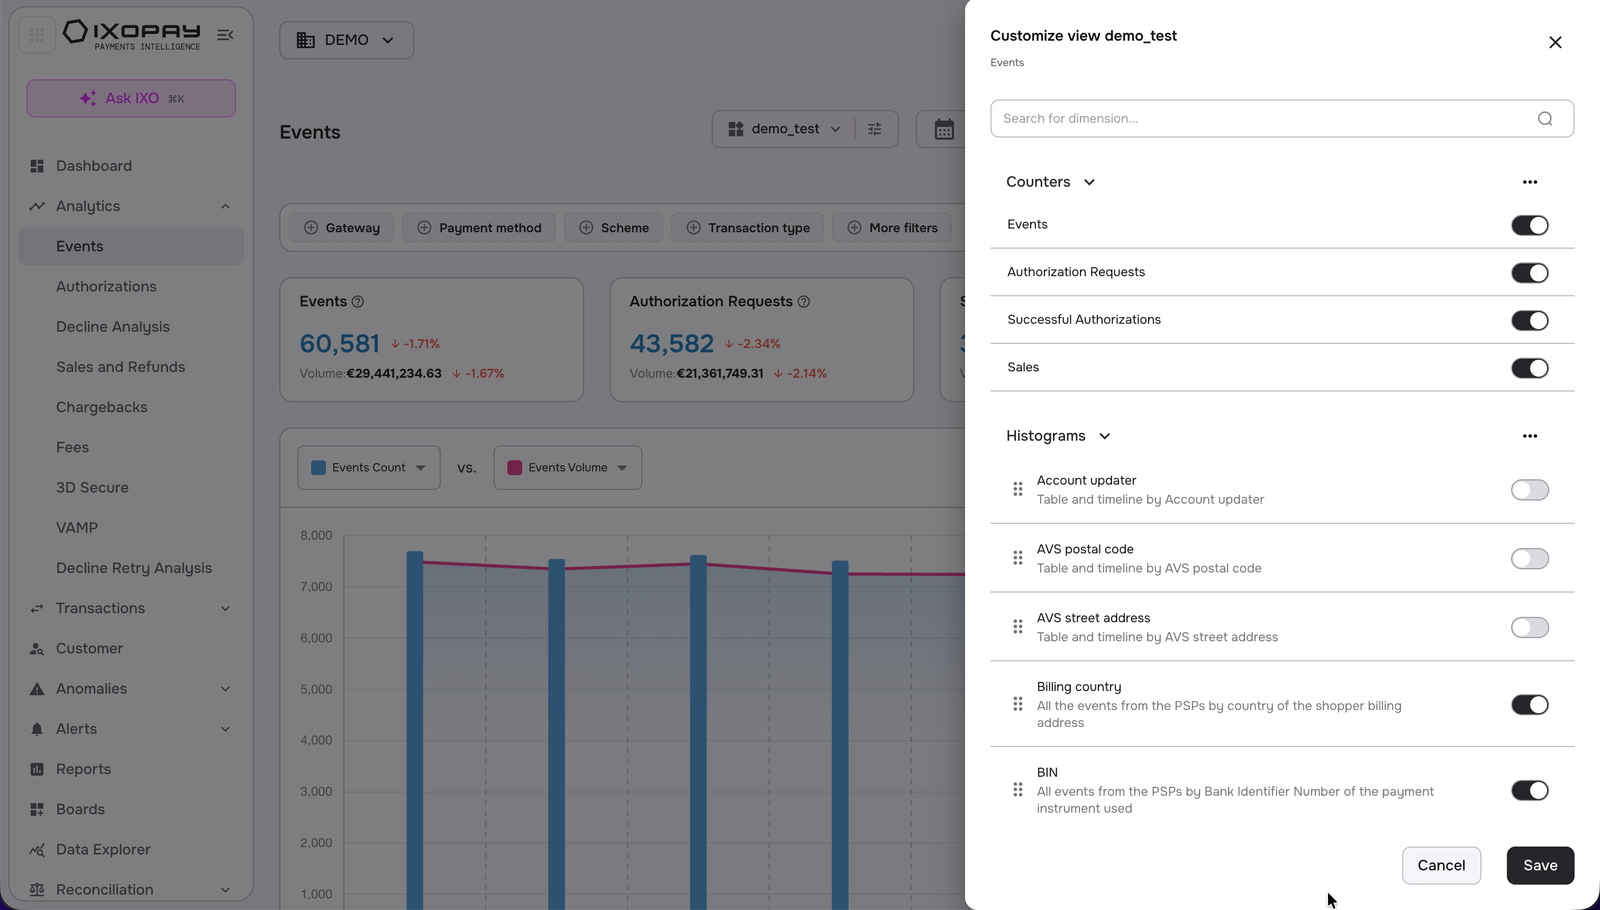
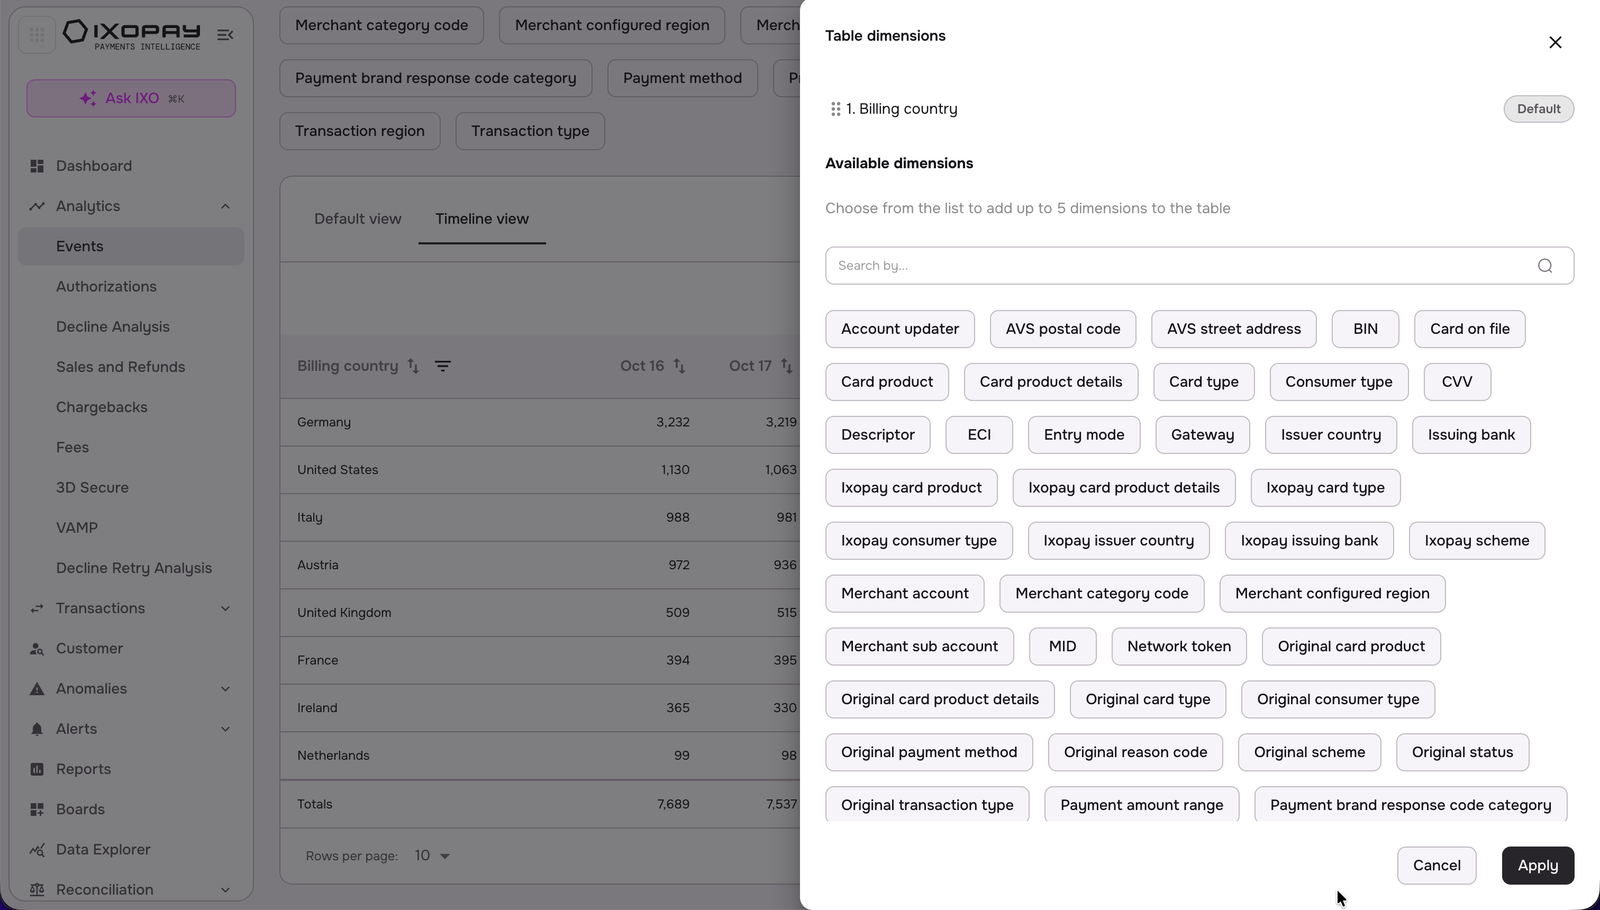
The Analytics dashboards offer a high level of customization, allowing users to tailor the KPIs displayed based on their specific needs. By turning on or off individual KPI dimensions, users have the flexibility to choose which key performance indicators they want to focus on.
This customization ensures that the dashboard presents only the most relevant data for each user, helping them stay focused on the metrics that matter most to their analysis or decision-making. Whether you're monitoring a broad set of KPIs or zooming in on a few specific ones, the ability to adjust the display helps to optimize the dashboard experience.
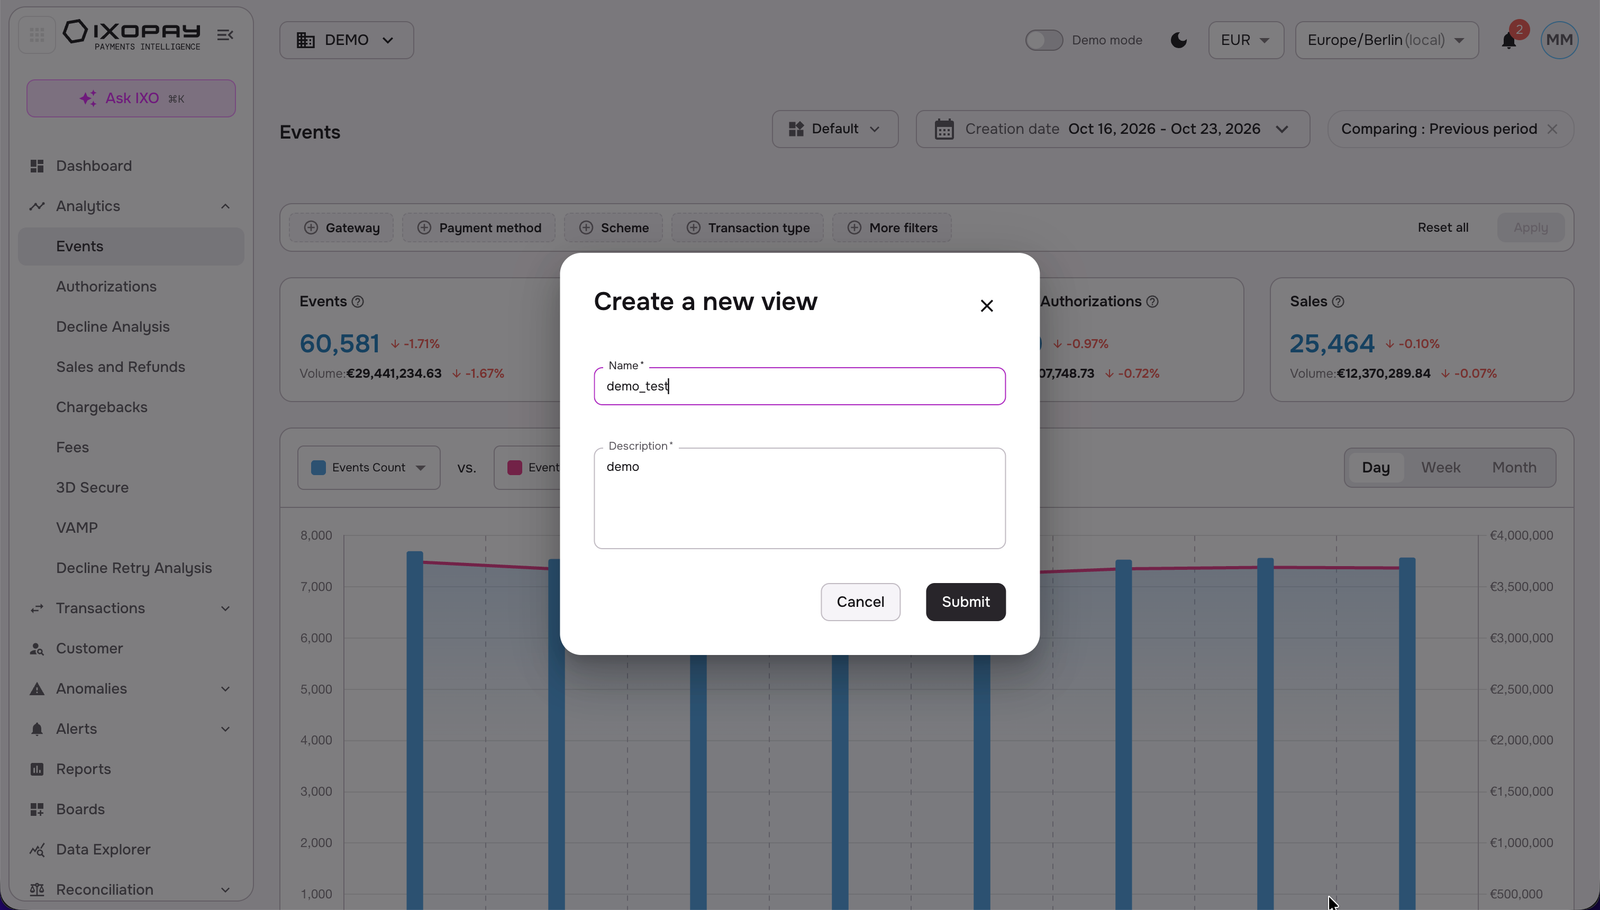
To create a custom view:
-
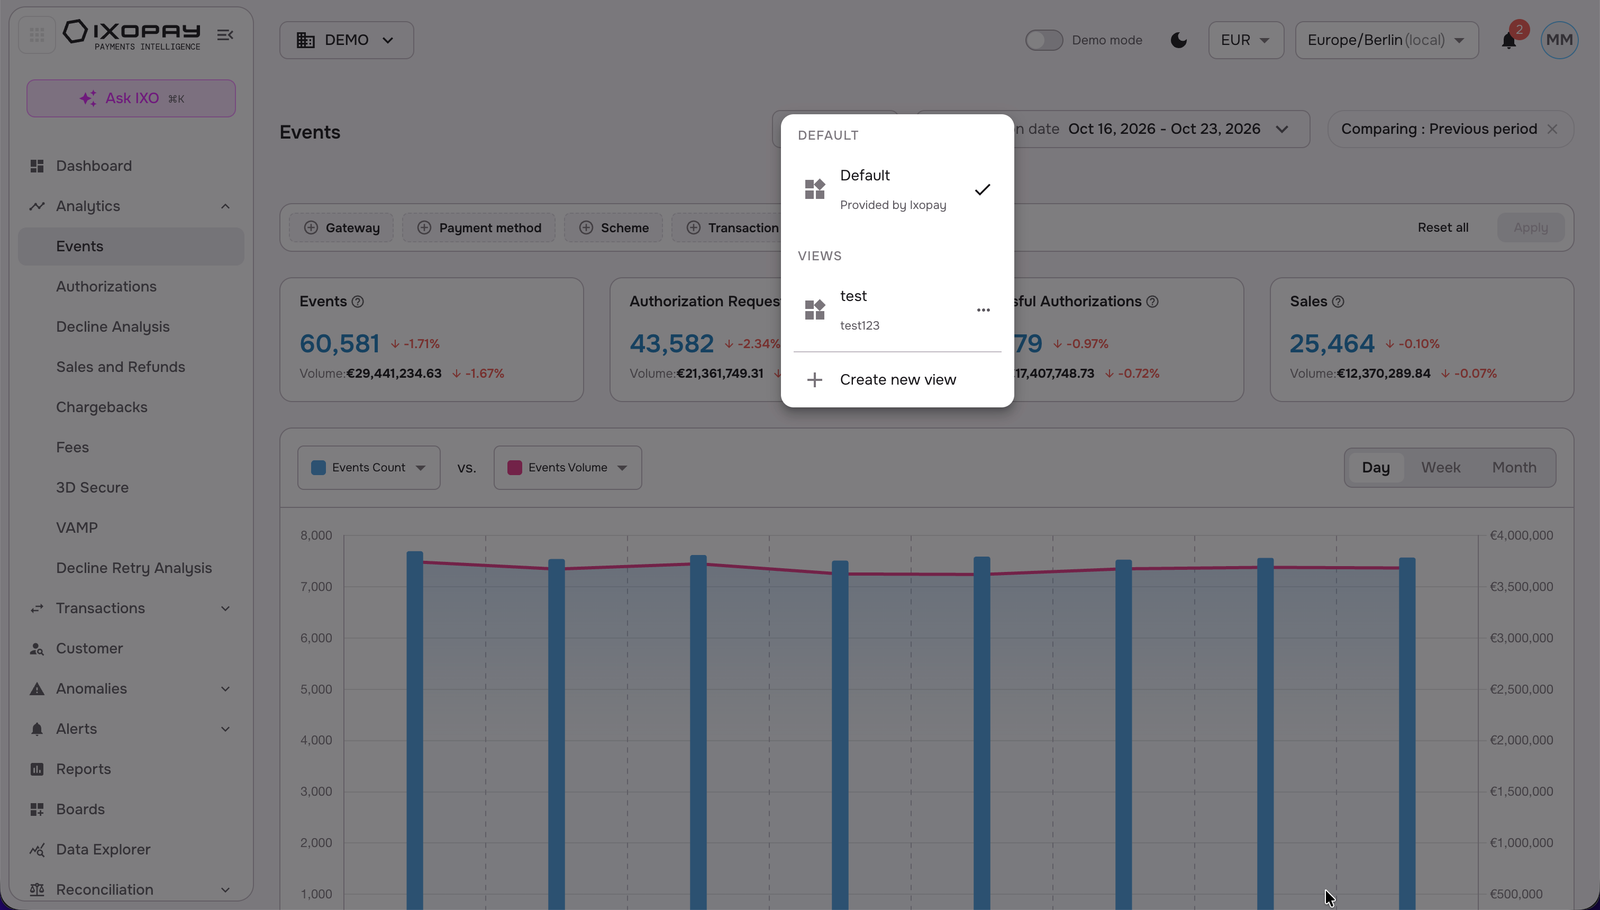
Click on “Default” view button, and then on “create a new view”
-
Add the name and description, and click on “submit”
-
You can now begin customizing your view, enable/disable specific data dimensions, move the orders, order alphabetically, and select or deselect all.
Timeseries
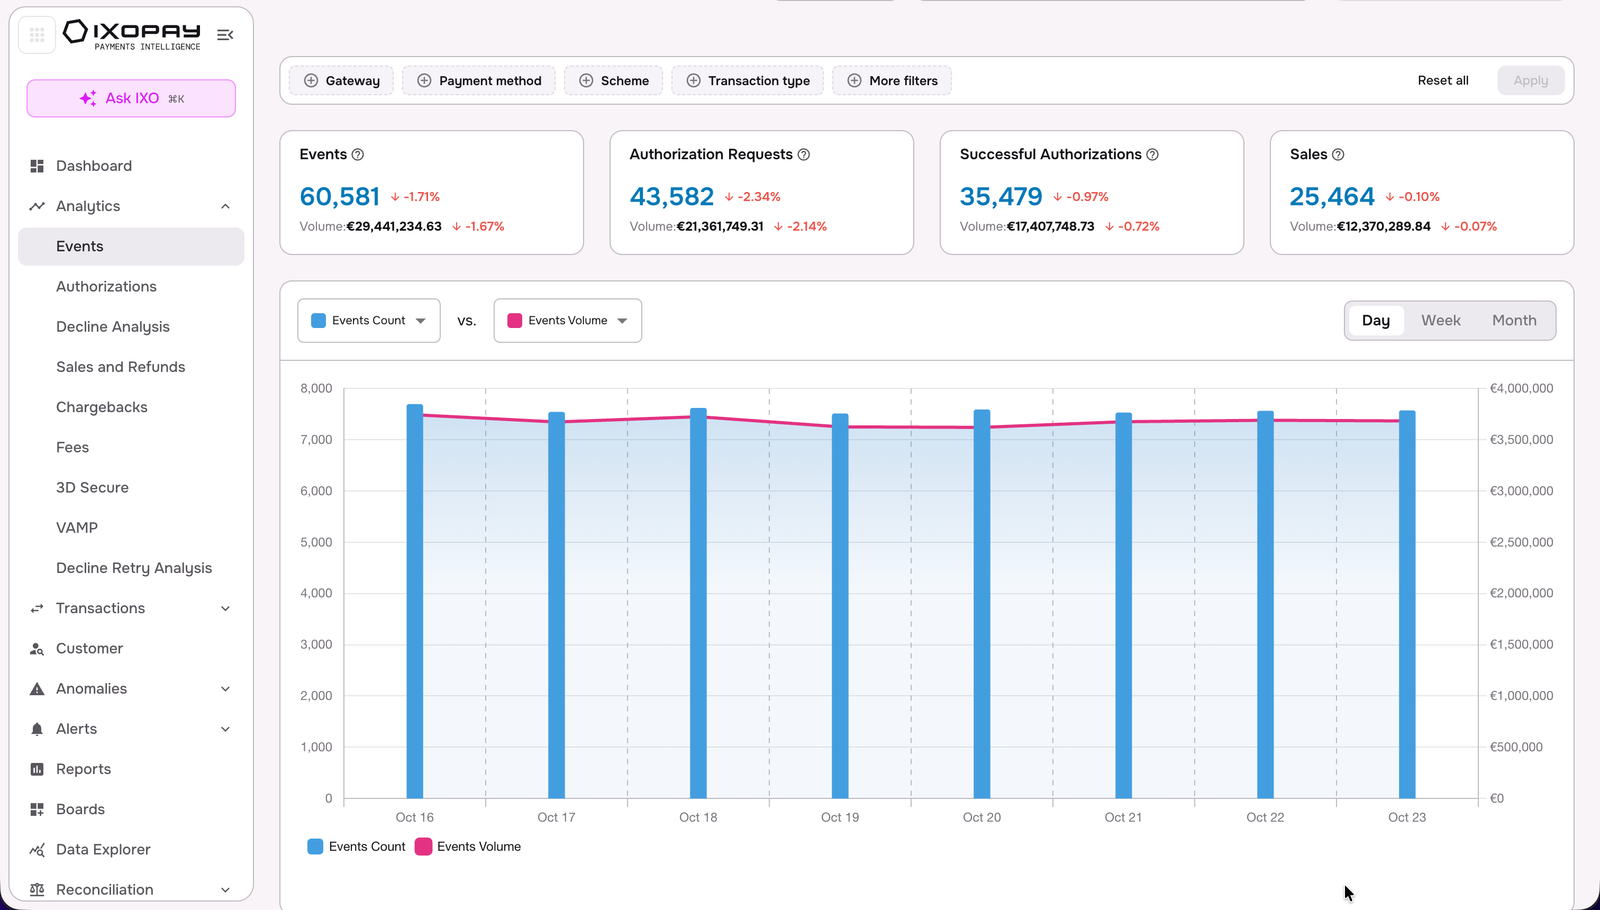
Each dashboard includes a timeline series chart that enables users to compare multiple KPIs across different timescales. In each time series you can select multiple KPIs and hide a KPI by clicking on the legend. This feature allows for a dynamic analysis of performance trends over time, with options to view the data on a daily, weekly, or monthly basis.
By adjusting the timescale, users can gain deeper insights into short-term fluctuations, medium-term trends, or long-term patterns, making it easier to identify key shifts or anomalies in the data. This flexibility enhances the ability to perform detailed time-based comparisons, helping users make more informed decisions.
Charts
A variety of chart types to visualize data effectively are offered. By default, dimensions are displayed using histogram charts, which provide a clear view of data distributions and comparisons across categories.
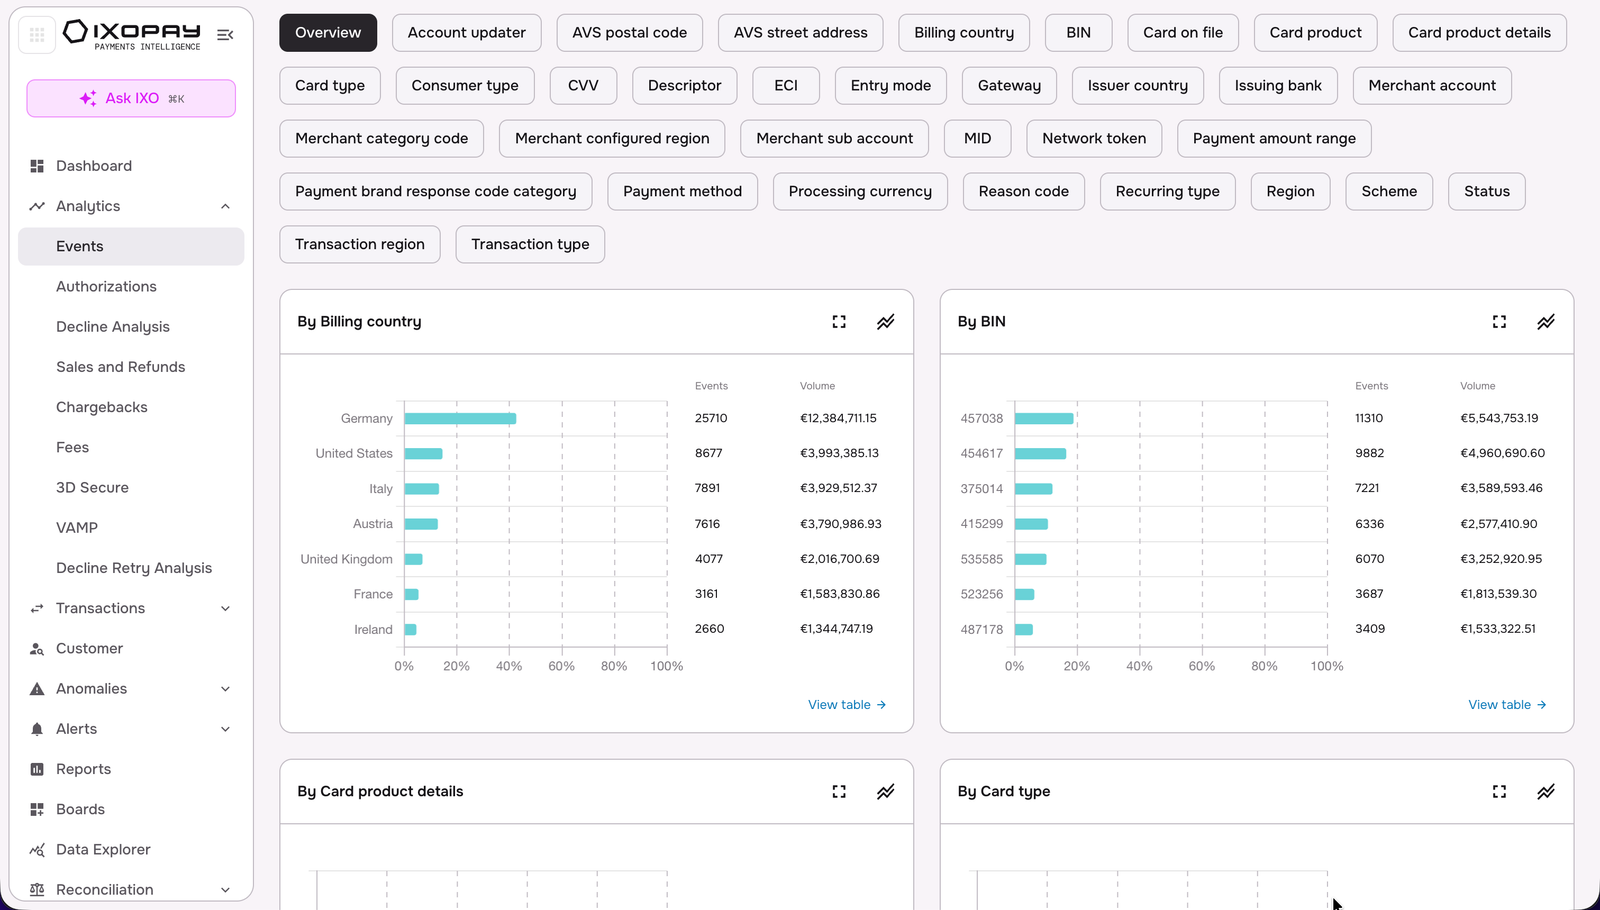
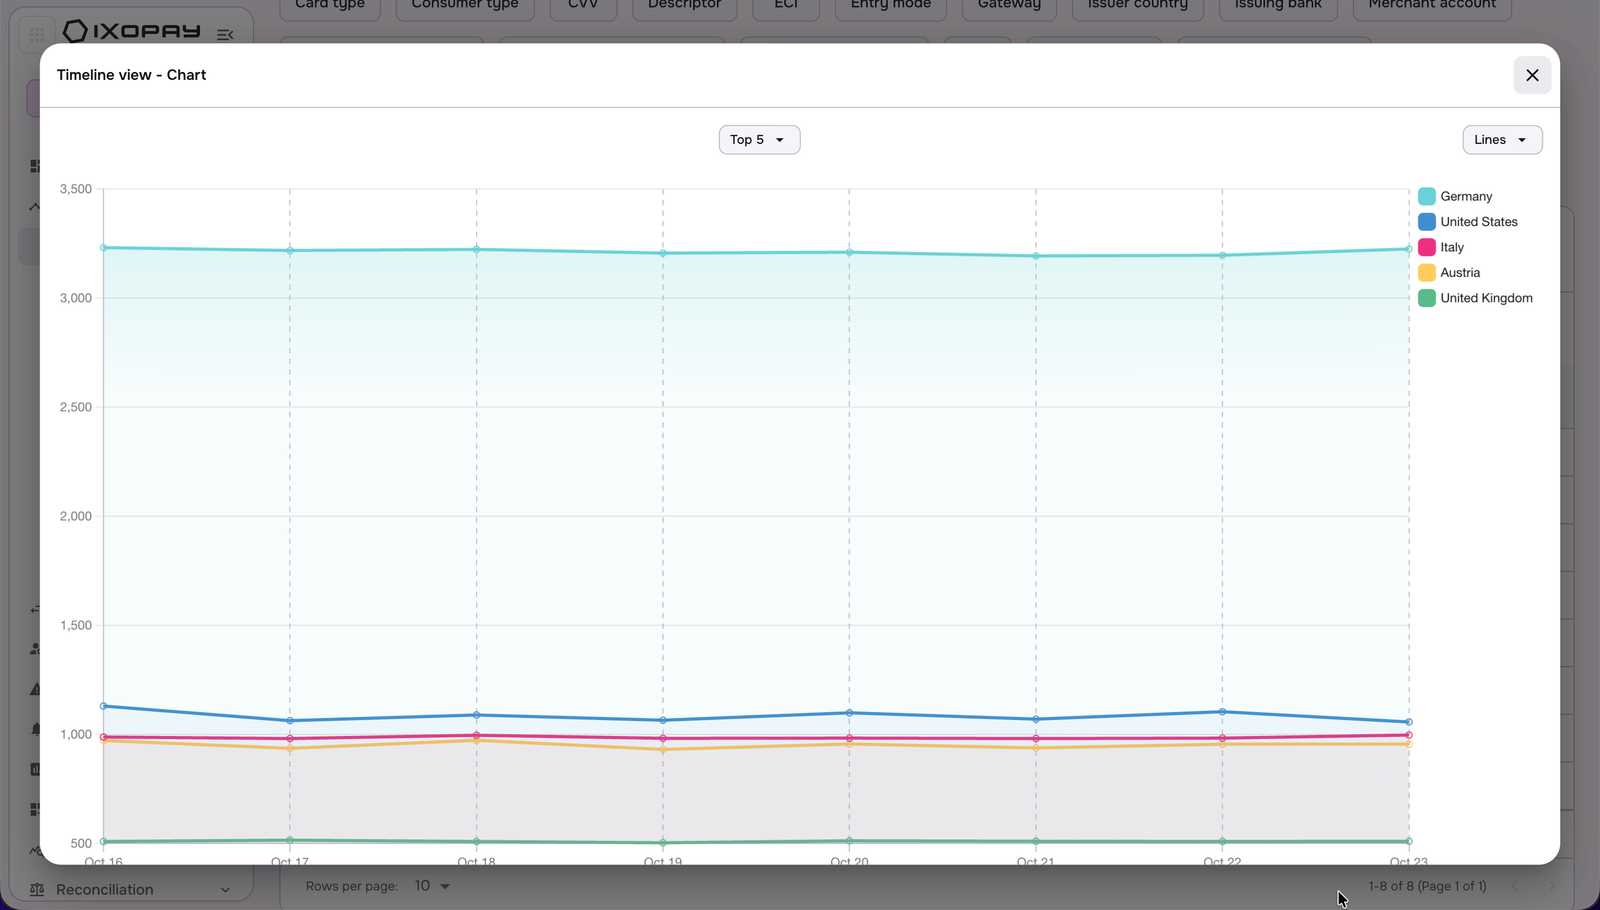
However, users have the flexibility to switch these histograms into time series charts, allowing for a time-based analysis of trends and performance over time. This ability to toggle between chart types ensures that users can choose the most suitable visualization for their specific analysis, enhancing both clarity and depth of insights.
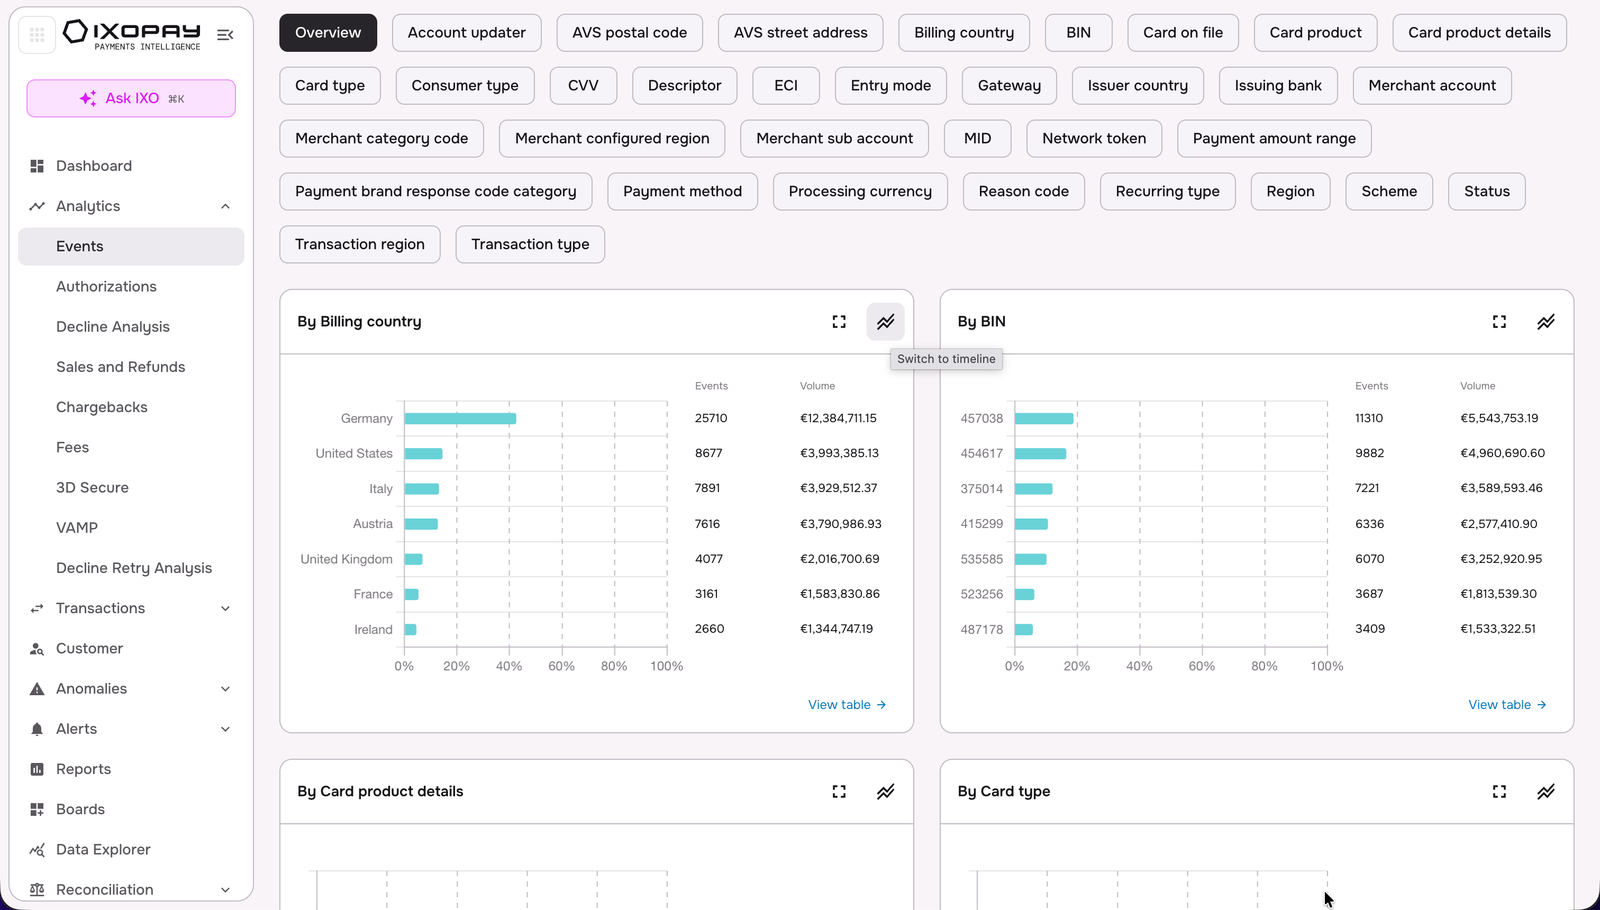
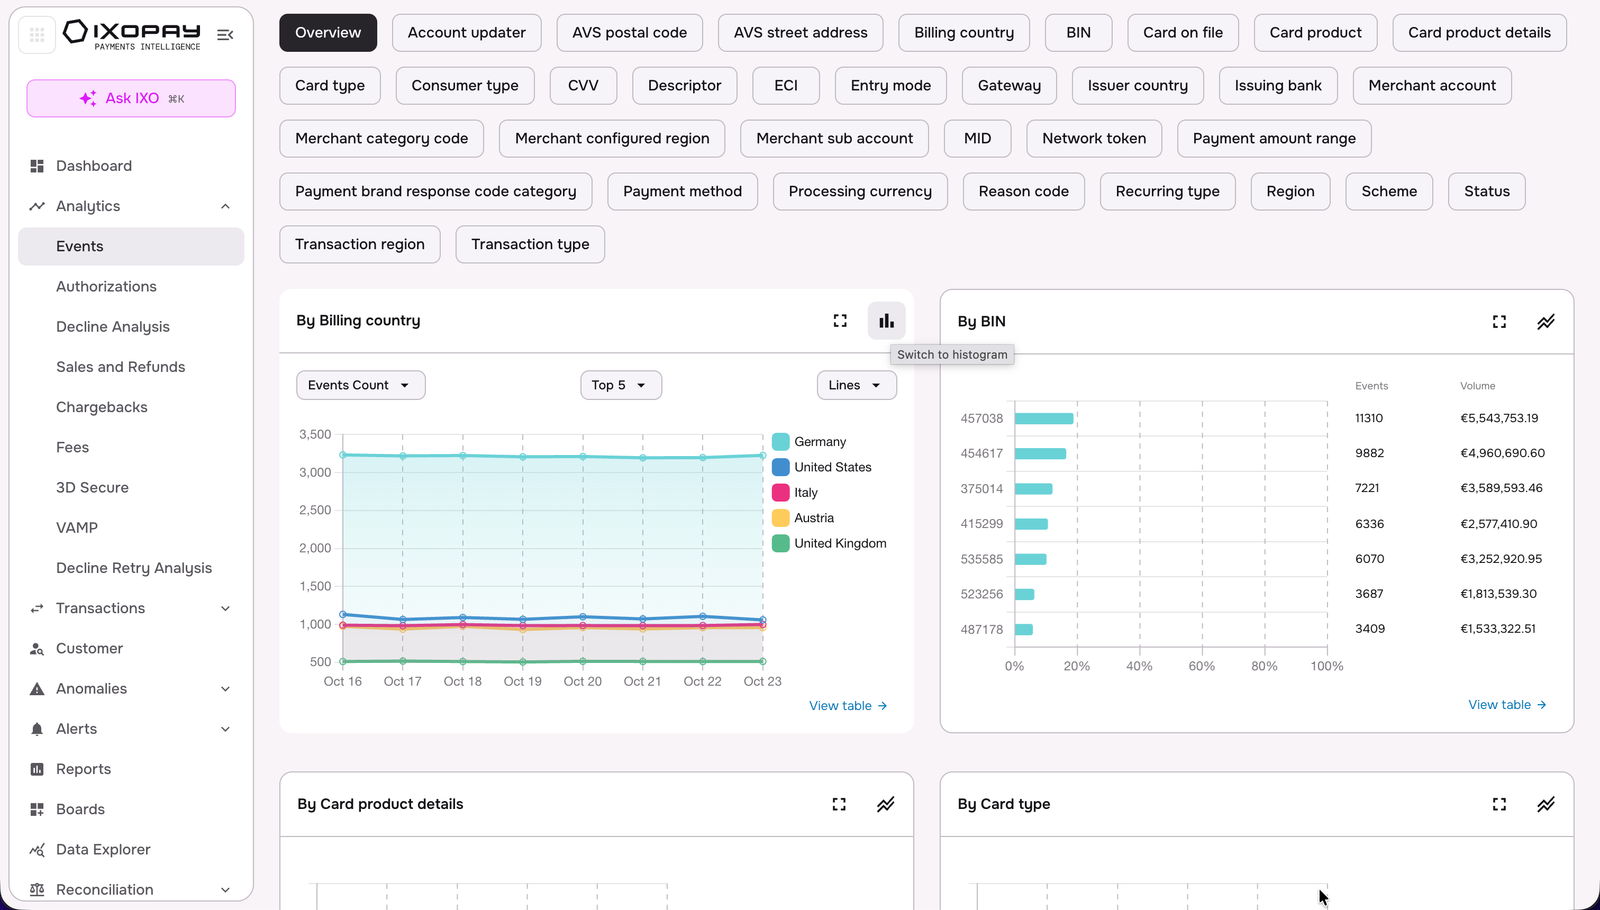
Table Views
To enable a deeper dive into the data, IXOPAY Payments Intelligence offers detailed table views. These views allow users to explore the data in more granular detail, whether in an aggregated table format or a timeline view.
The table view presents data in a structured layout, helping users quickly compare values across different dimensions or time periods.
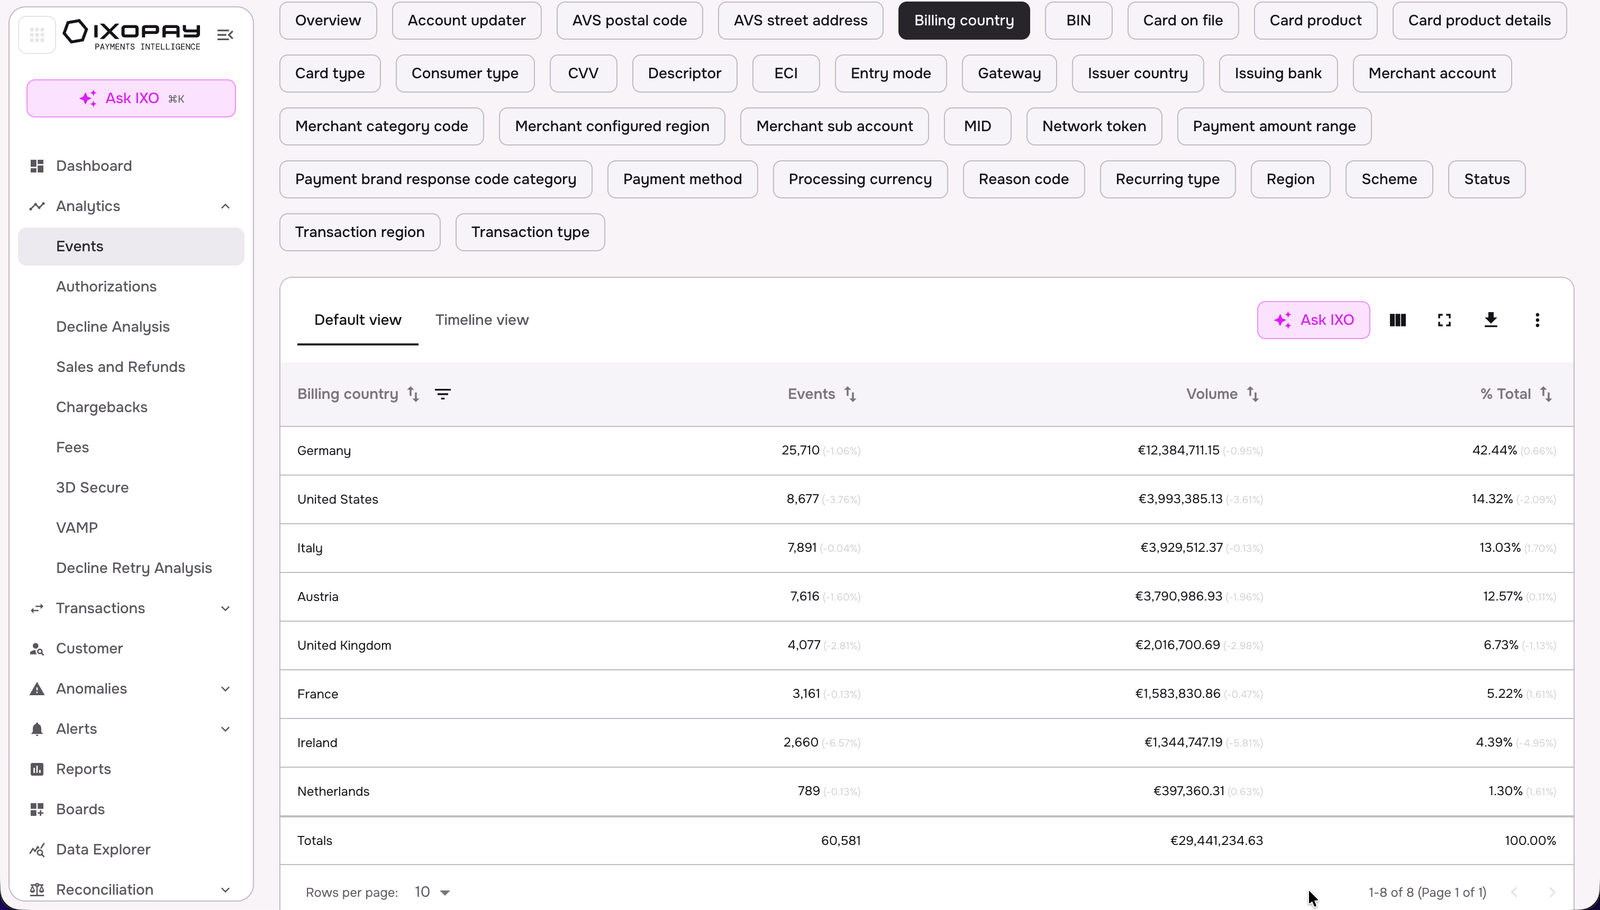
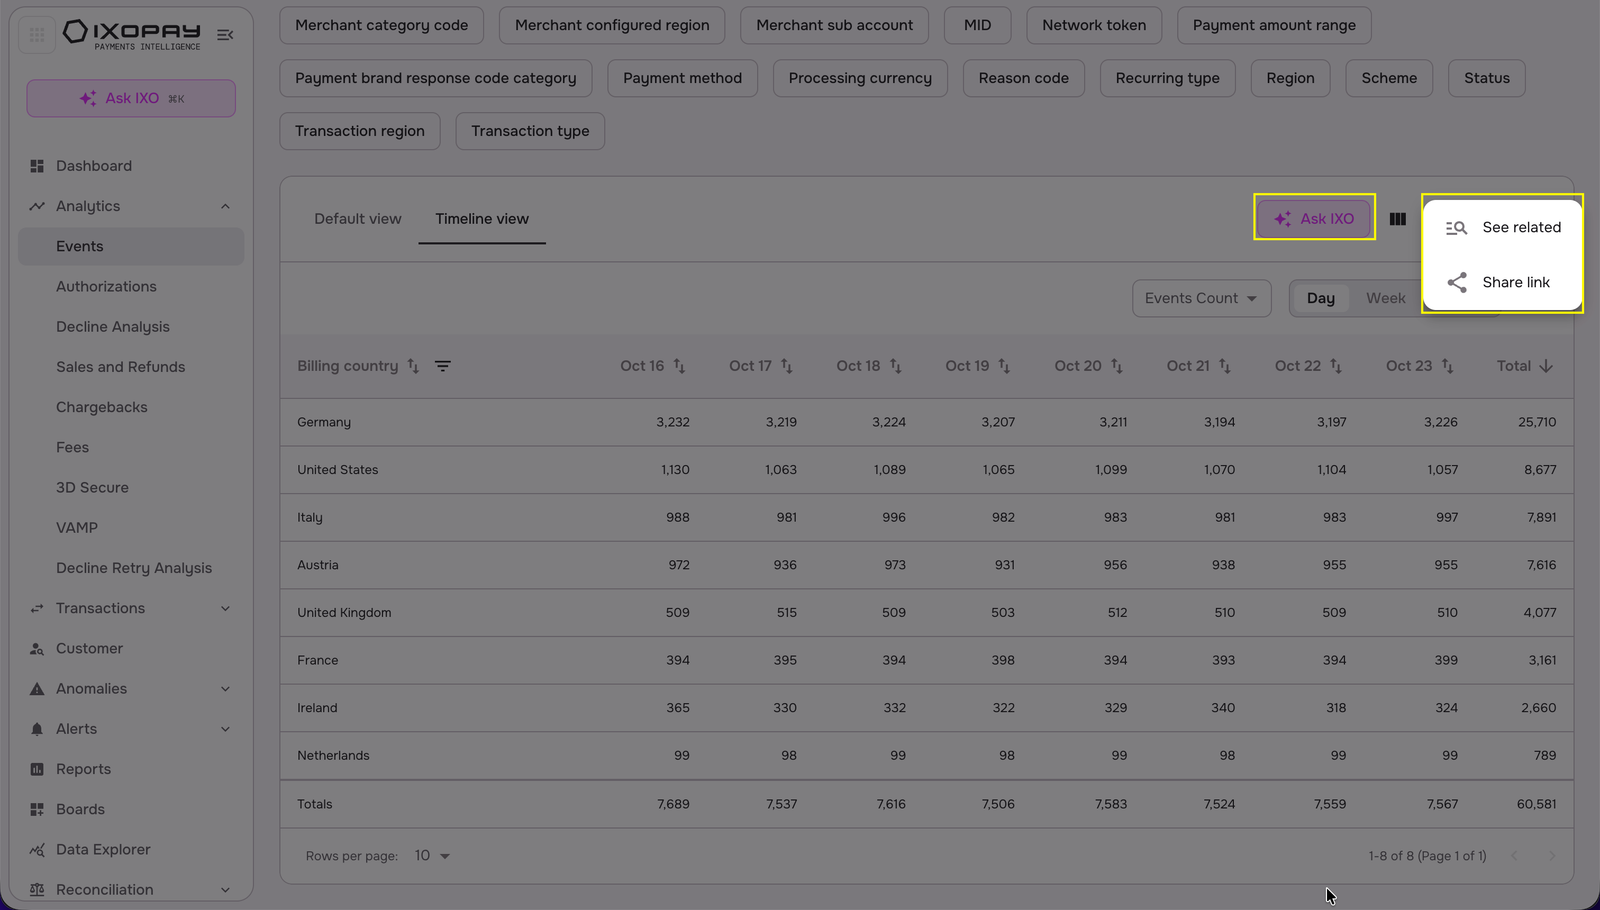
For a clearer understanding of trends and comparisons over time, users can switch to the timeline view, which visualizes the data chronologically. This combination of table and timeline views enhances the ability to analyze patterns, uncover insights, and make data-driven decisions with a comprehensive perspective.
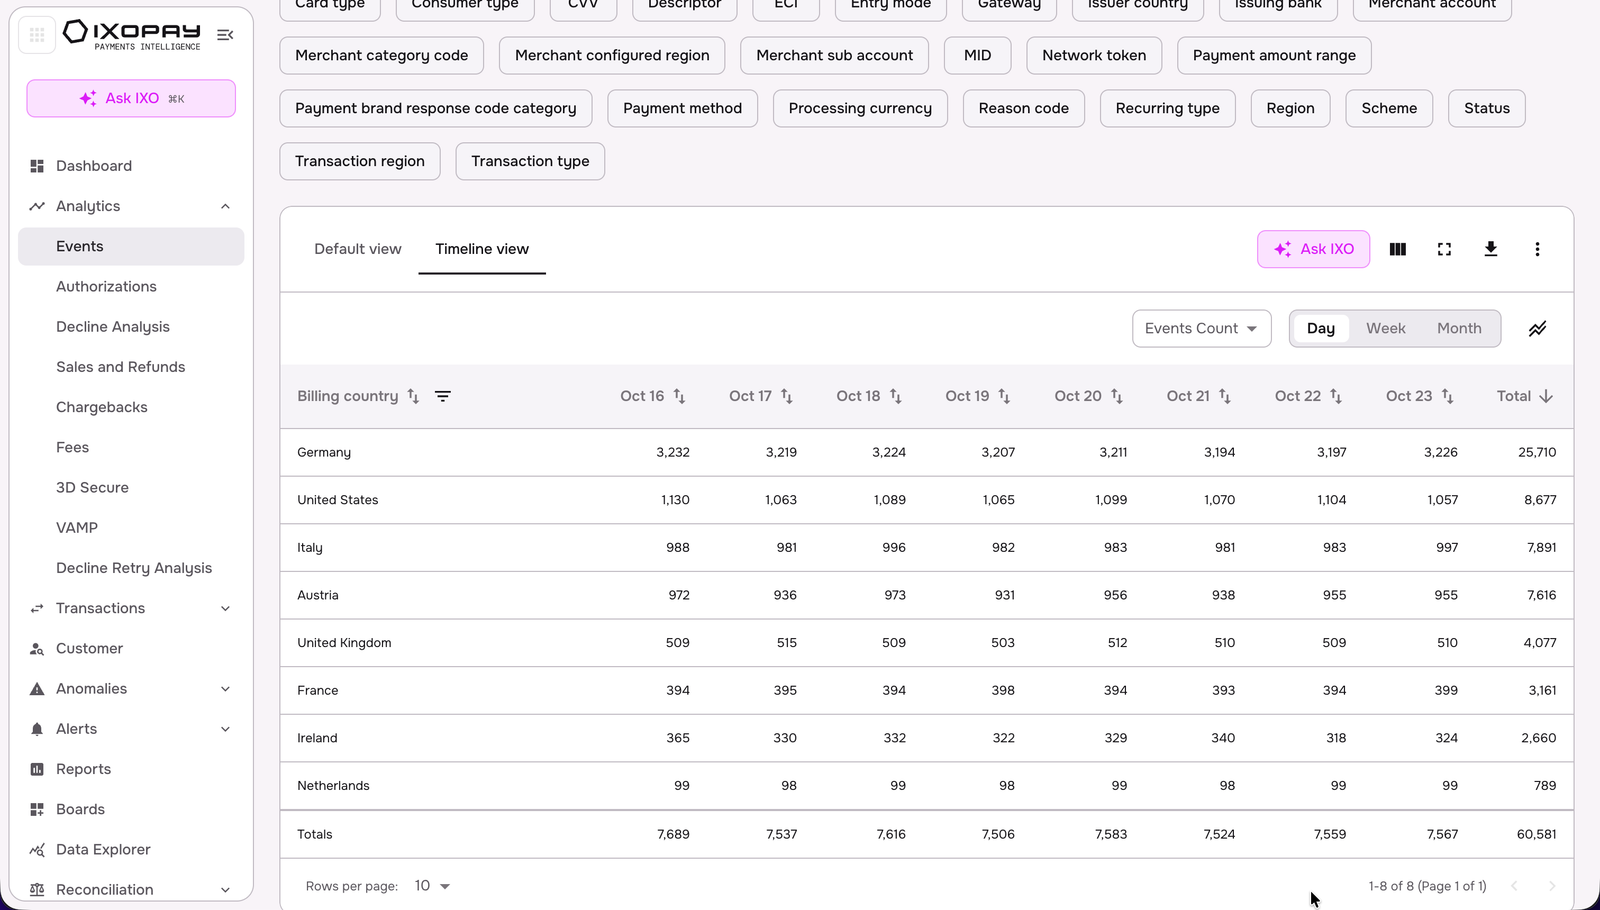
You can also see the timeline view as a chart.
If you want to add or remove dimensions, click on the edit icon, then apply the changes.
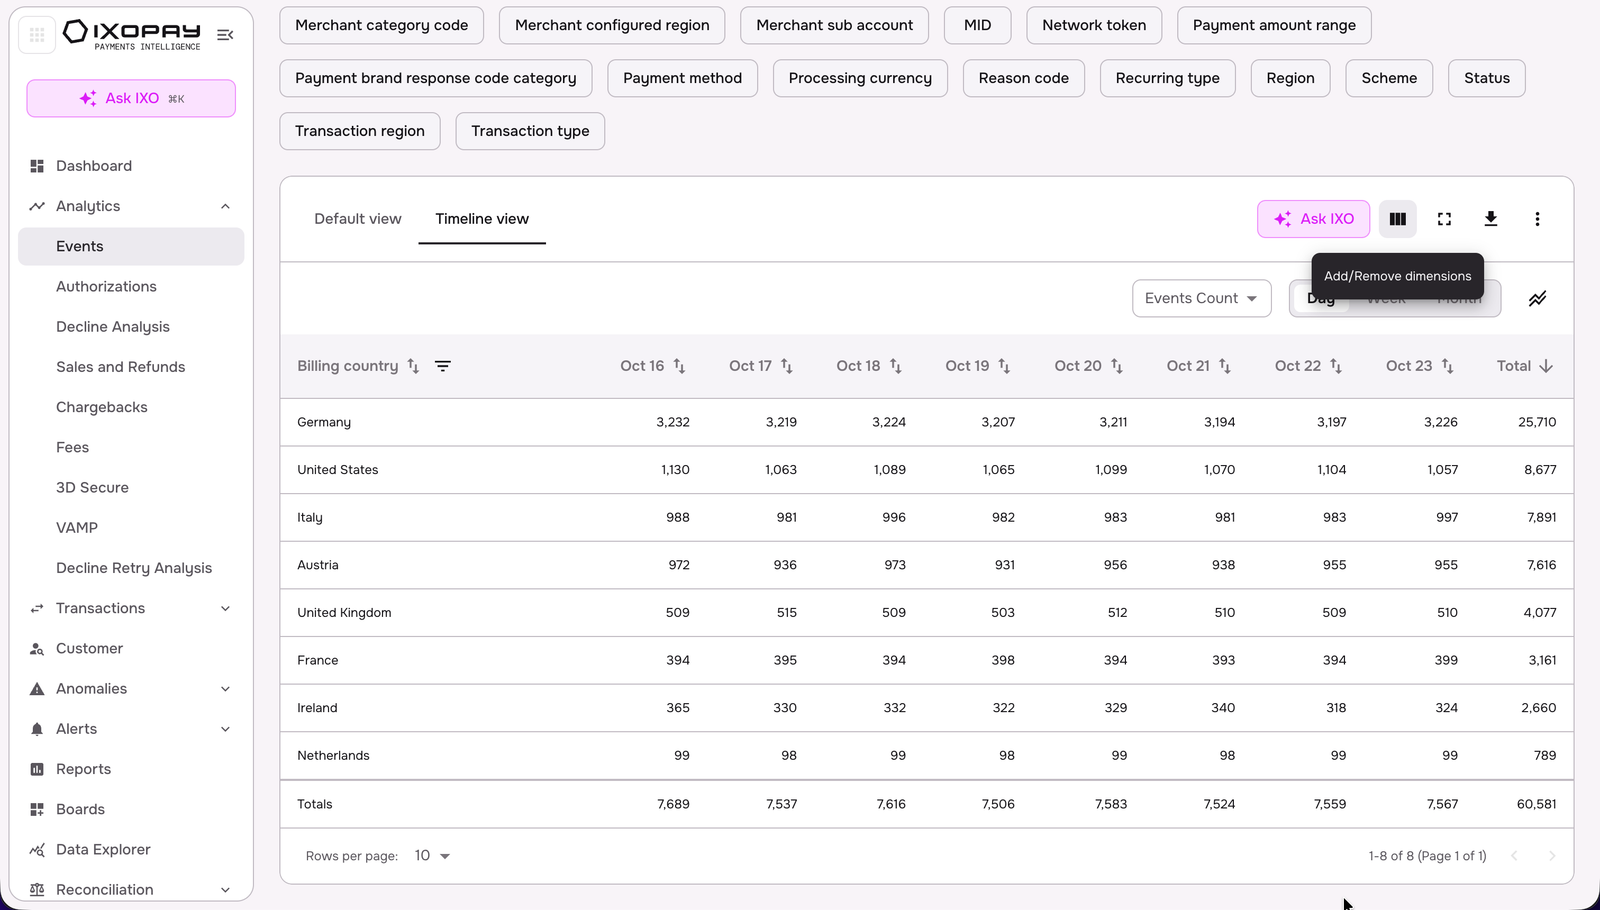
You can directly prompt IXO AI to summarize the table view by clicking on 'Ask IXO', and click on the three dots button if you want to see related transactions, export the table, or share the link.