Anomaly Detection
The IXOPAY Payments Intelligence Anomaly Detection module is an AI-driven "early warning system" designed for modern merchants operating in a multi-PSP environment. By unifying fragmented data from providers, it identifies hidden revenue leaks and operational failures that traditional static reporting tools miss.
Core Capabilities
-
Automated Baseline Modeling: IXOPAY Payments Intelligence's machine learning models automatically learn your "normal" performance patterns - accounting for seasonality, regional trends, and specific payment methods - so you only get alerted when a deviation is statistically significant.
-
Granular Attribute Monitoring: Anomalies rarely affect your whole business. IXOPAY Payments Intelligence pinpoints issues down to specific slices: a single issuer cluster, a specific BIN range, or a particular 3DS authentication flow behaving irregularly on one processor.
-
Unified Decline Analysis: By standardizing "Reason Codes" across all your PSPs into a single internal language, the platform can detect sudden surges in specific failure types (e.g., "Do Not Honor" or "Technical Error") across different providers simultaneously.
-
Economic Drift Detection: Beyond technical failures, the system monitors your Cost of Acceptance. It flags "economic anomalies," such as unexpected shifts in interchange categories or sudden "scheme fee" spikes that erode your margins.
Key features of the anomaly detection capabilities in IXOPAY Payments Intelligence
| Feature | Business Impact |
|---|---|
| Instant Alerts | Stop waiting for end-of-month reports. Get notified the moment a gateway times out or fraud spikes. |
| No-Code Analytics | Deploy sophisticated ML monitoring without writing a single line of SQL or building an in-house data science team. |
| Root Cause Diagnostics | Don't just see the "what," see the "why." Alerts are enriched with context across attributes giving you clarity on the anomalous behaviour. |
| Revenue Protection | Identify "quiet drifts" i.e. gradual declines in performance that compound over time, before they escalate into major outages. |
Detected Anomalies reported to you in near real-time
Anomalies found in the payment behaviour and operations can be viewed by navigating to the Anomalies → Detected Anomalies tab on the IXOPAY Payments Intelligence platform.
Here you will find the detected anomalies in payment operations and behaviour data, which have been classified in Critical, Read/ Unread and Resolved state, along with a list of anomalies, with brief information of the grouping dimensions (to be read as AND conditions) and volume impact predicted in your default currency.
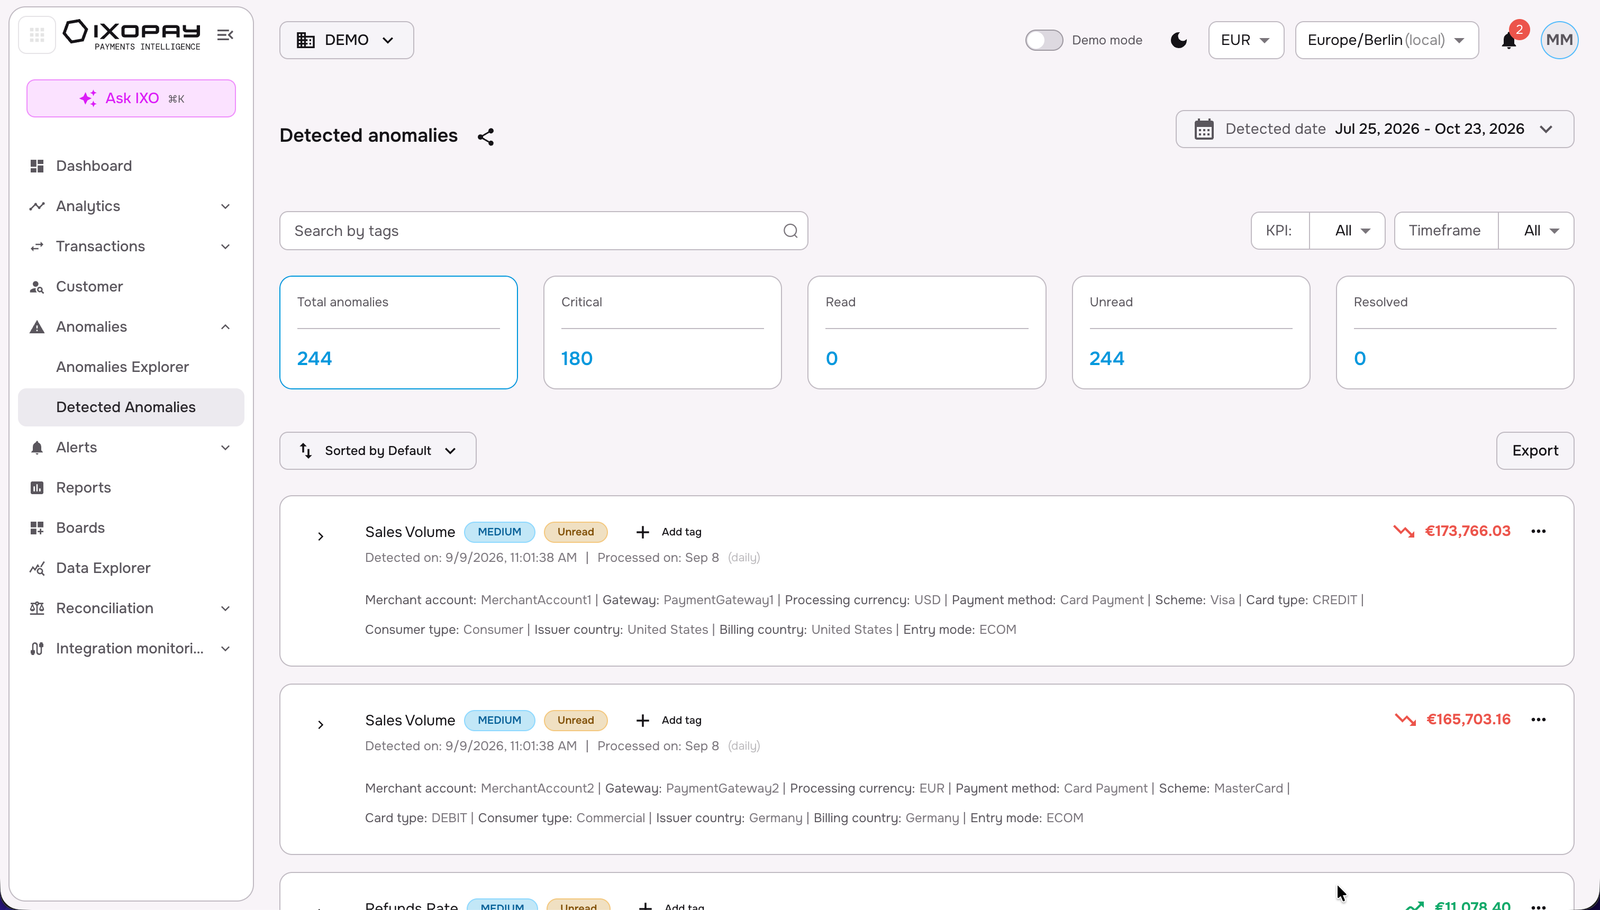
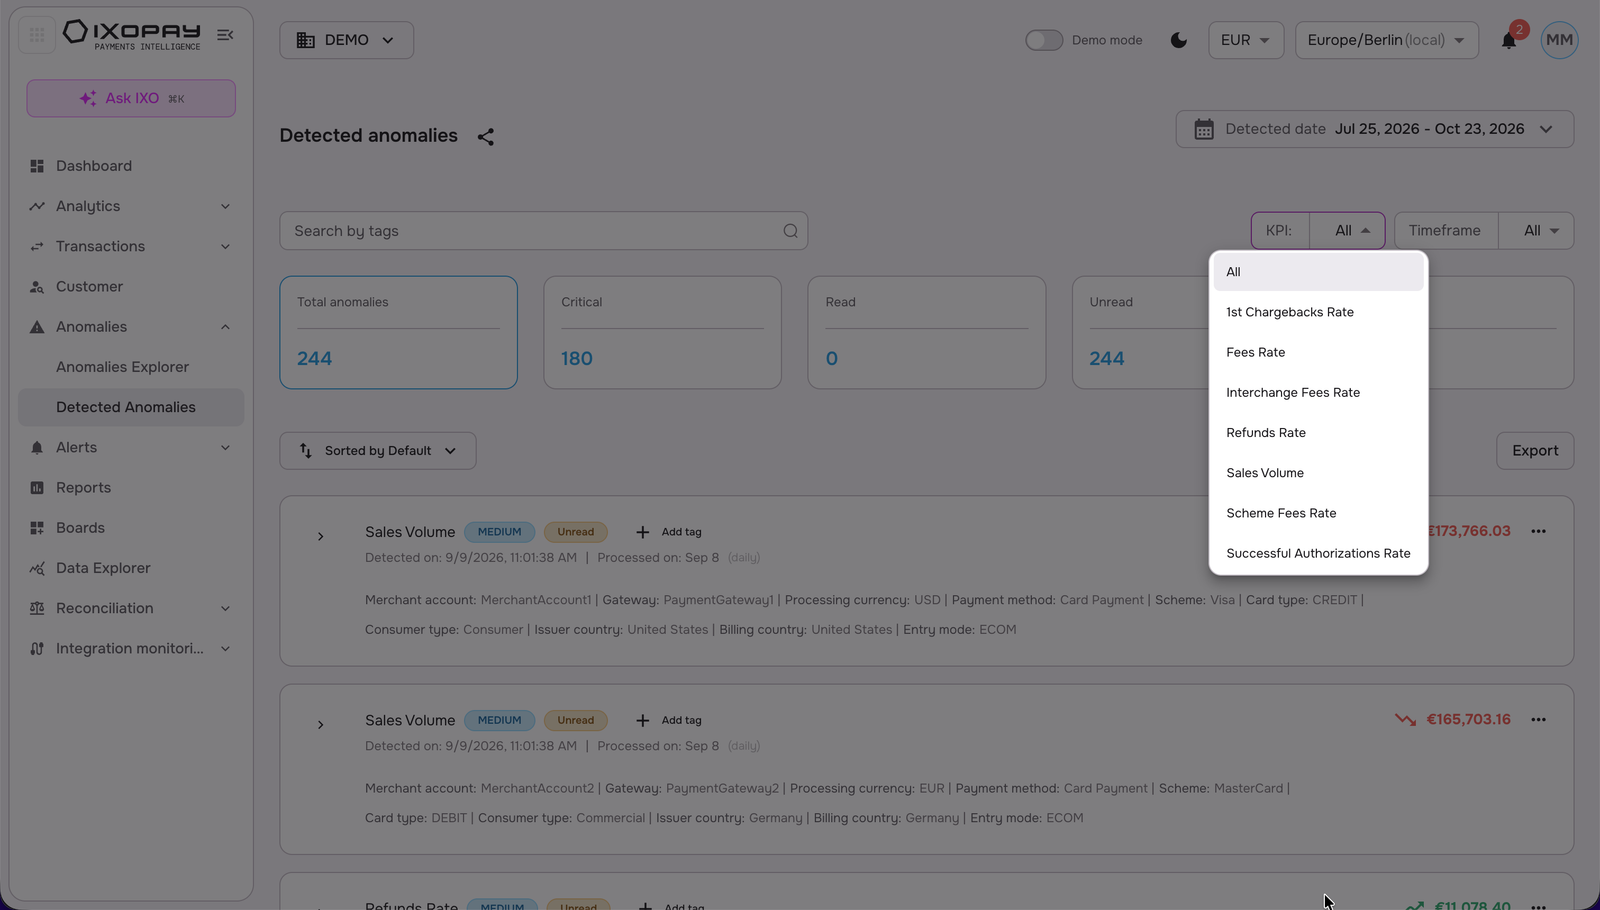
You can further refine the anomalies detected by the KPI and timeframe when it was detected/ processed.
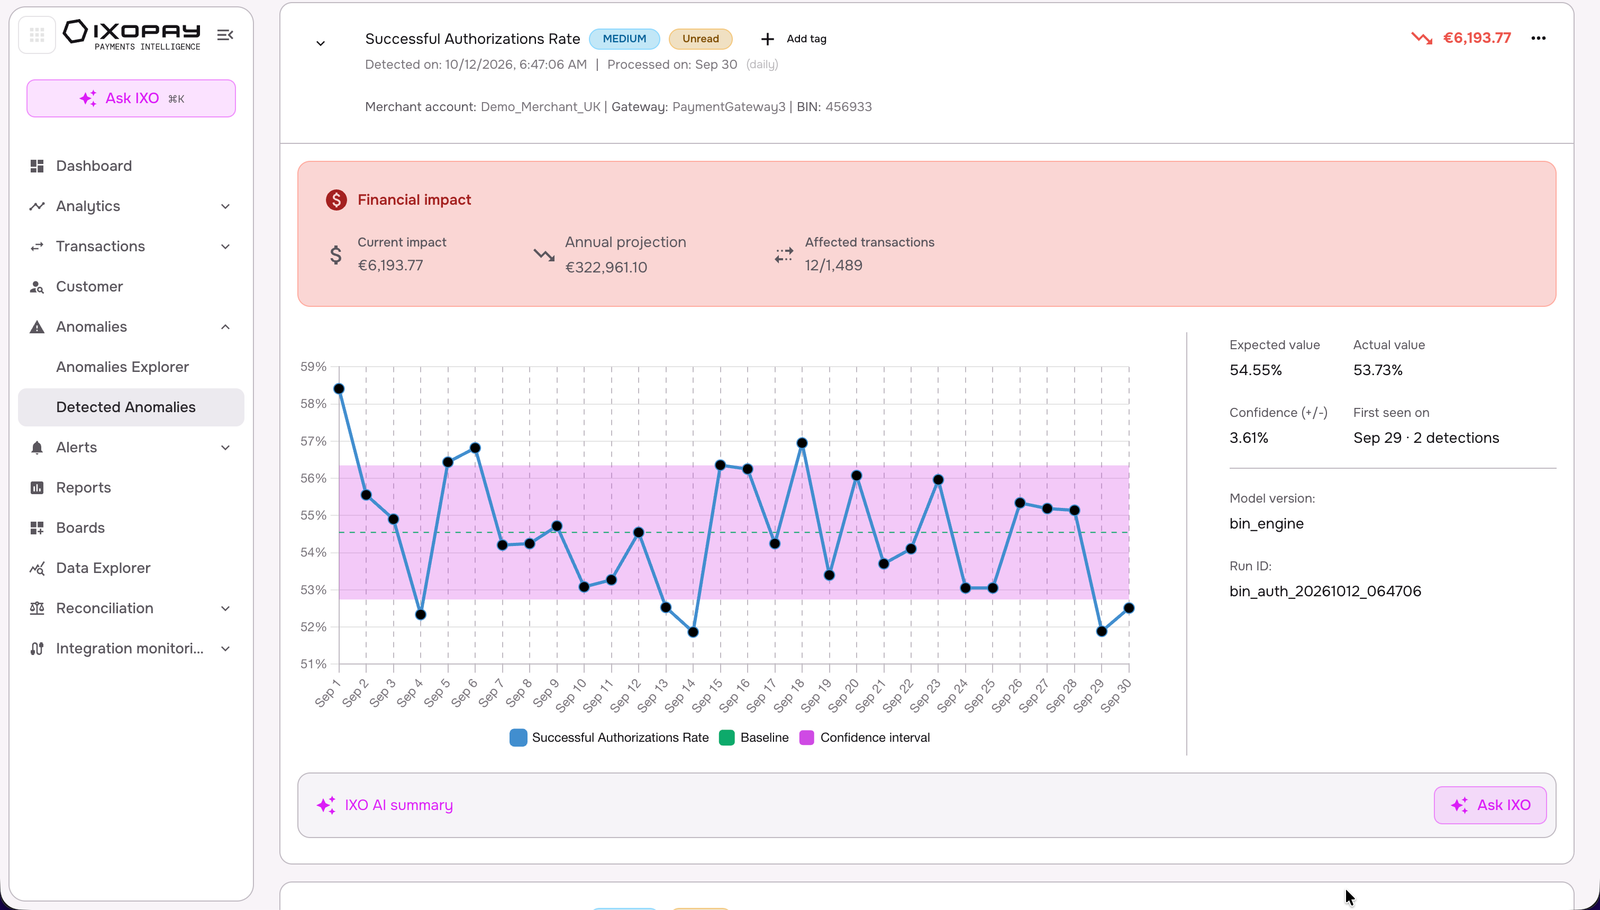
You can deep-dive into the detected anomaly directly from the listed view by clicking on the Arrow button on the left of the Anomaly tile, which creates a drop-down showing the:
-
Financial Impact i.e. the current impact in default currency, number of transactions affected, and extrapolation of the impact to annual projection; and
-
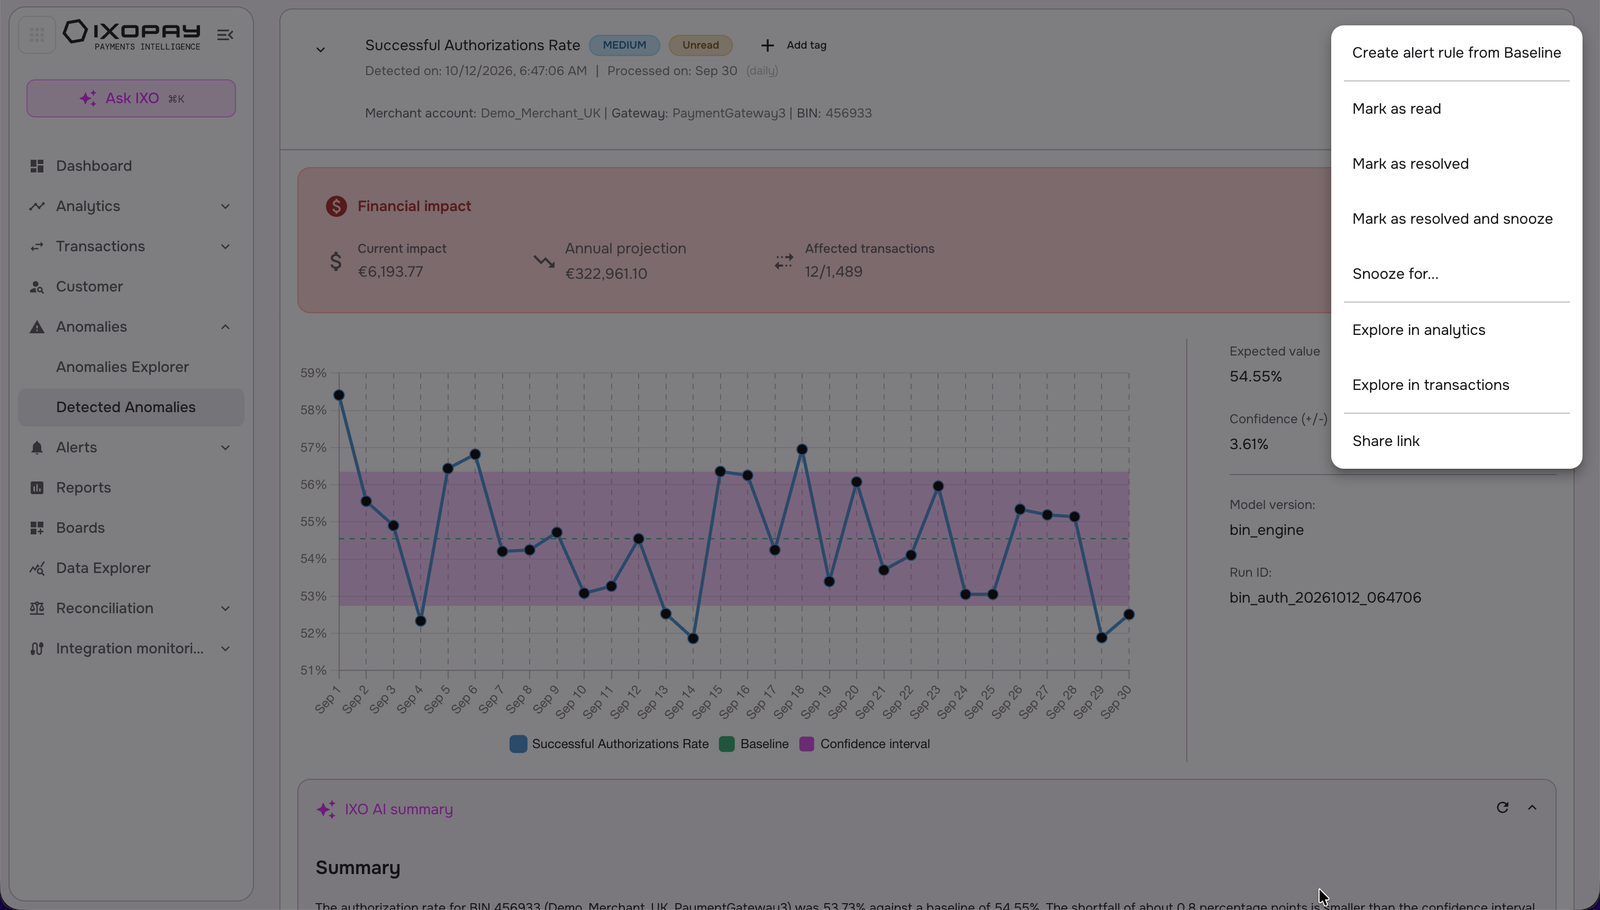
Visualization of the detected anomaly (actual value, such as the Successful Authorization Rate in the example below) vs. the baseline/ predicted performance (Expected value ± the confidence interval), as predicted by the IXOPAY Payments Intelligence anomaly detection model, relevant to the grouping dimensions (i.e. in the example shown below - anomaly detected on demo merchant account using demo payment gateway on Visa scheme, for credit-card payments in USD on the Merchants e-commerce platform, by private consumers in the USA).
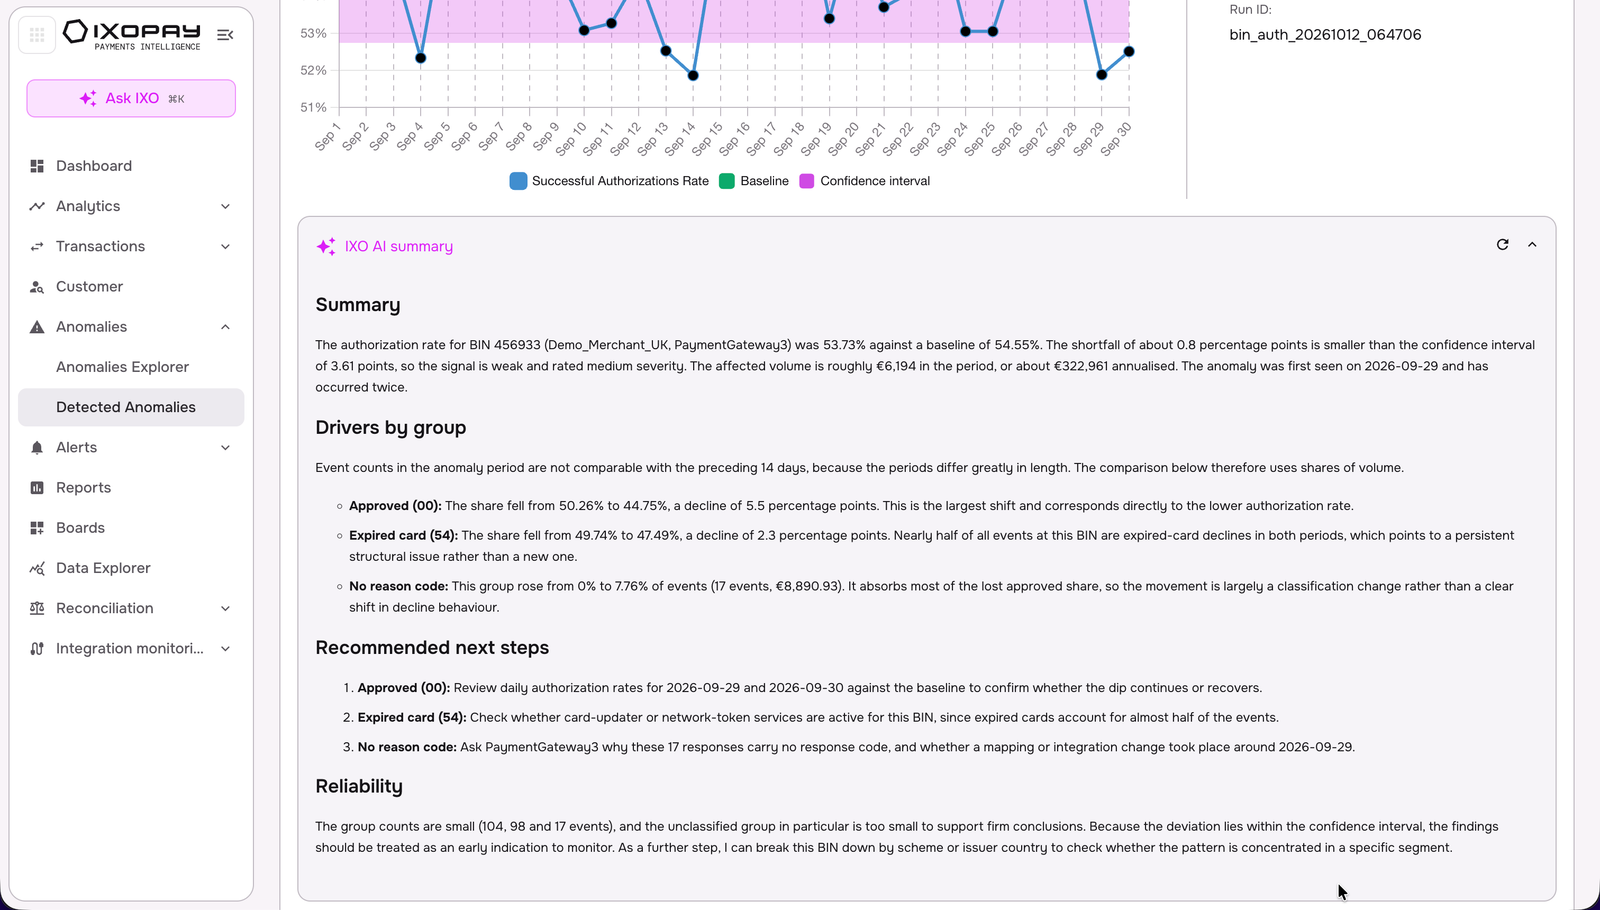
To get a relevant human-readable synopsis of the anomaly detected, you can click on the ‘Analyze’ text, next to AI Analysis, which will summarize the predicted vs actual result gaps, highlight insightful increases/ decreases in a time-period, and provide recommendations on how to reduce the cost impact through further exploration and operational optimization.
For further actions on the listed anomaly, click on the '…' button to :
-
Closely monitor your KPI against similar anomalies by creating an alert, which notifies you if the KPI deviates from the baseline, including setting sensitivity thresholds, slack integrations, etc. (see also Alerts)
-
Mark the listed anomaly as read or resolved or schedule a 'snooze' for re-notification
-
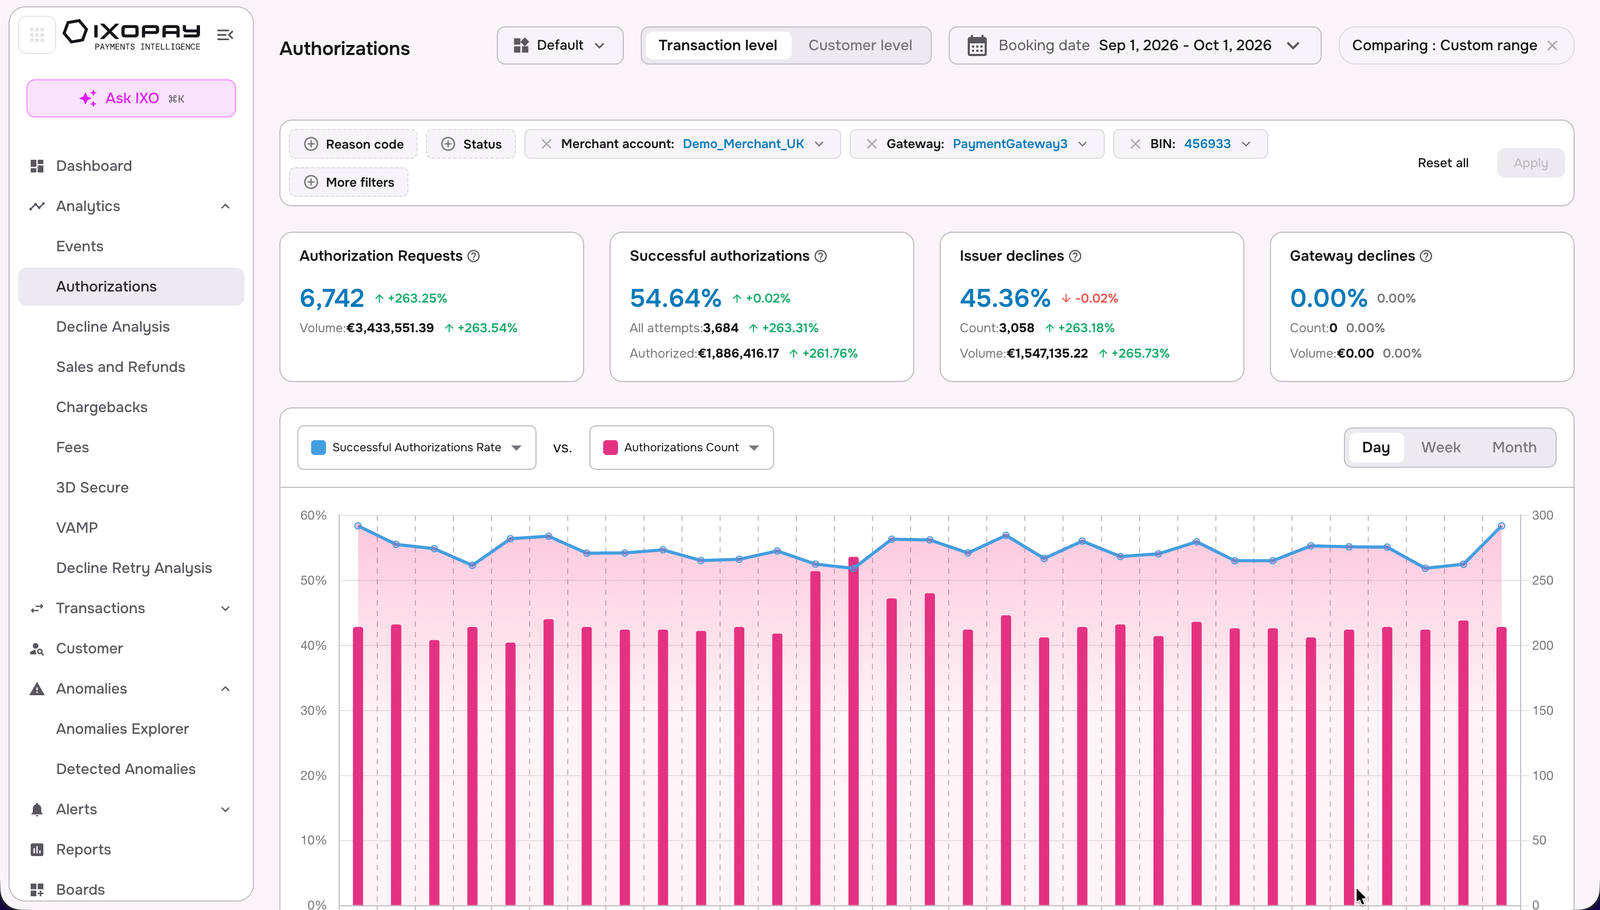
Explore the actual data on the KPI in the anomaly by clicking on 'Explore in analytics' which routes you to the Analytics page on IXOPAY Payments Intelligence, with filters automatically added (as per grouping dimensions), to create the relevant view of the actual data.
Example of ‘Explore in analytics’ routing to Analytics view with filters automatically added to show relevant actual successful authorization rate from the detected anomaly.
Creating and exploring Anomalies basis your dimensions
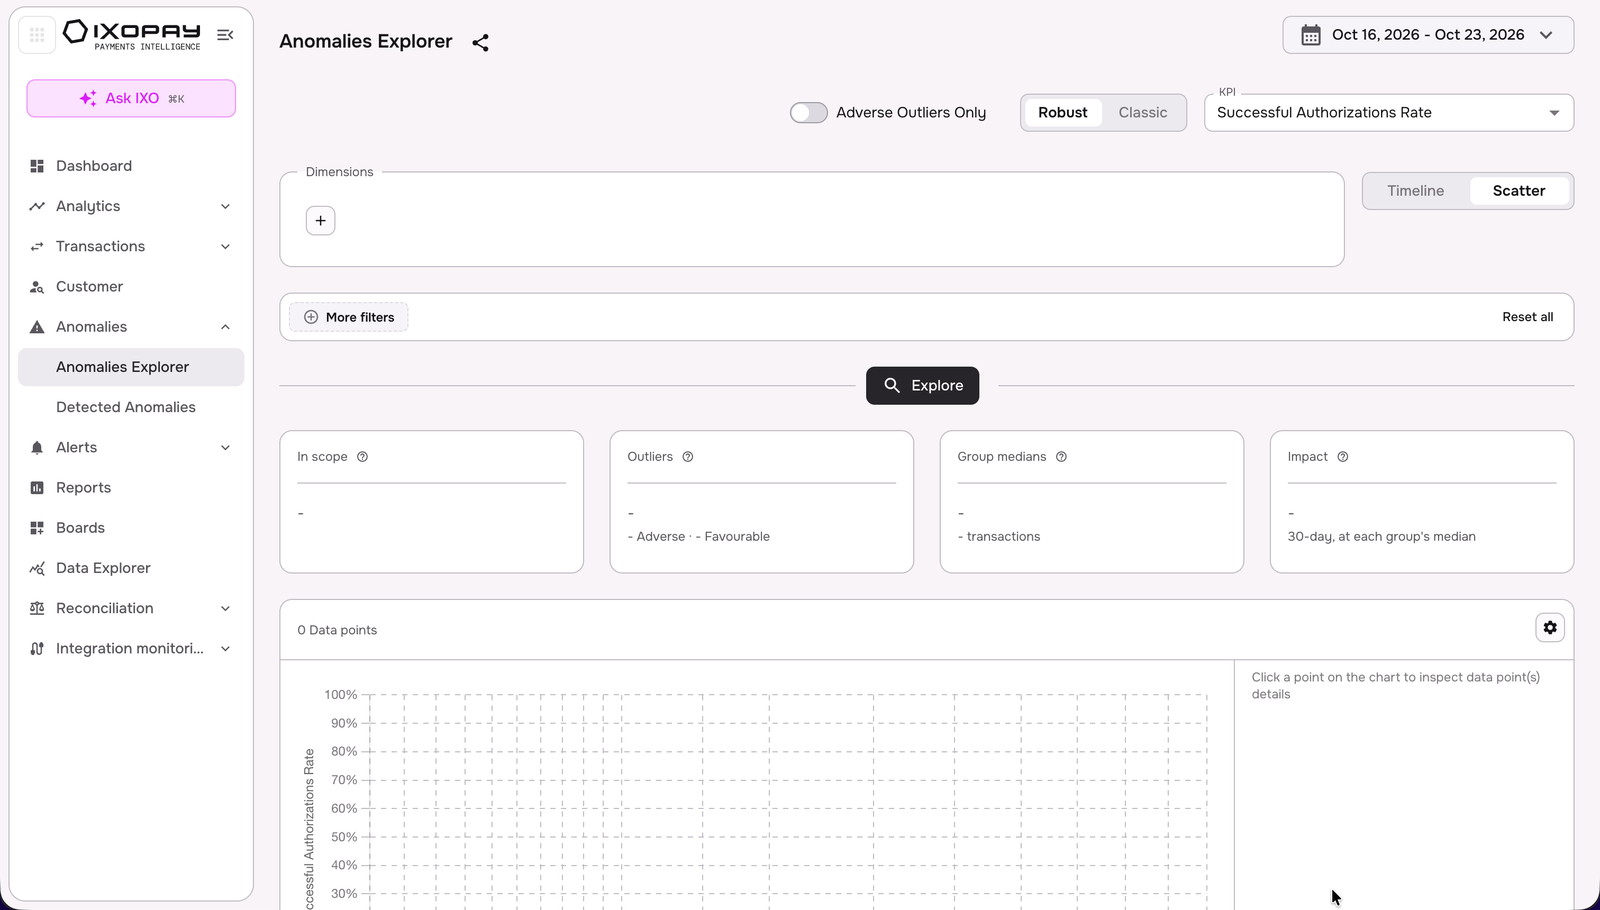
To identify and explore any anomalous payment behaviour on your Merchant data, you can navigate to the Anomalies → Anomalies Explorer tab on the IXOPAY Payments Intelligence platform.
Key features of the Anomalies Explorer tab
| Feature | Business Impact |
|---|---|
| Peer-baseline outlier detection | Spot under-performing metrics hidden inside healthy overall rates, without defining any thresholds yourself. |
| Robust and Classic baselines | Choose a Median-based baseline that is resistant to extreme values, or a Mean-based baseline for a traditional view. |
| Volume impact per BIN | See the revenue at stake for each outlier metric, so you can prioritize by business value rather than by rate alone. |
| AI summary with IXO AI | Get a human-readable synopsis of the outliers, aggregate impact and suggested next steps in a single click. |
Defining your scope
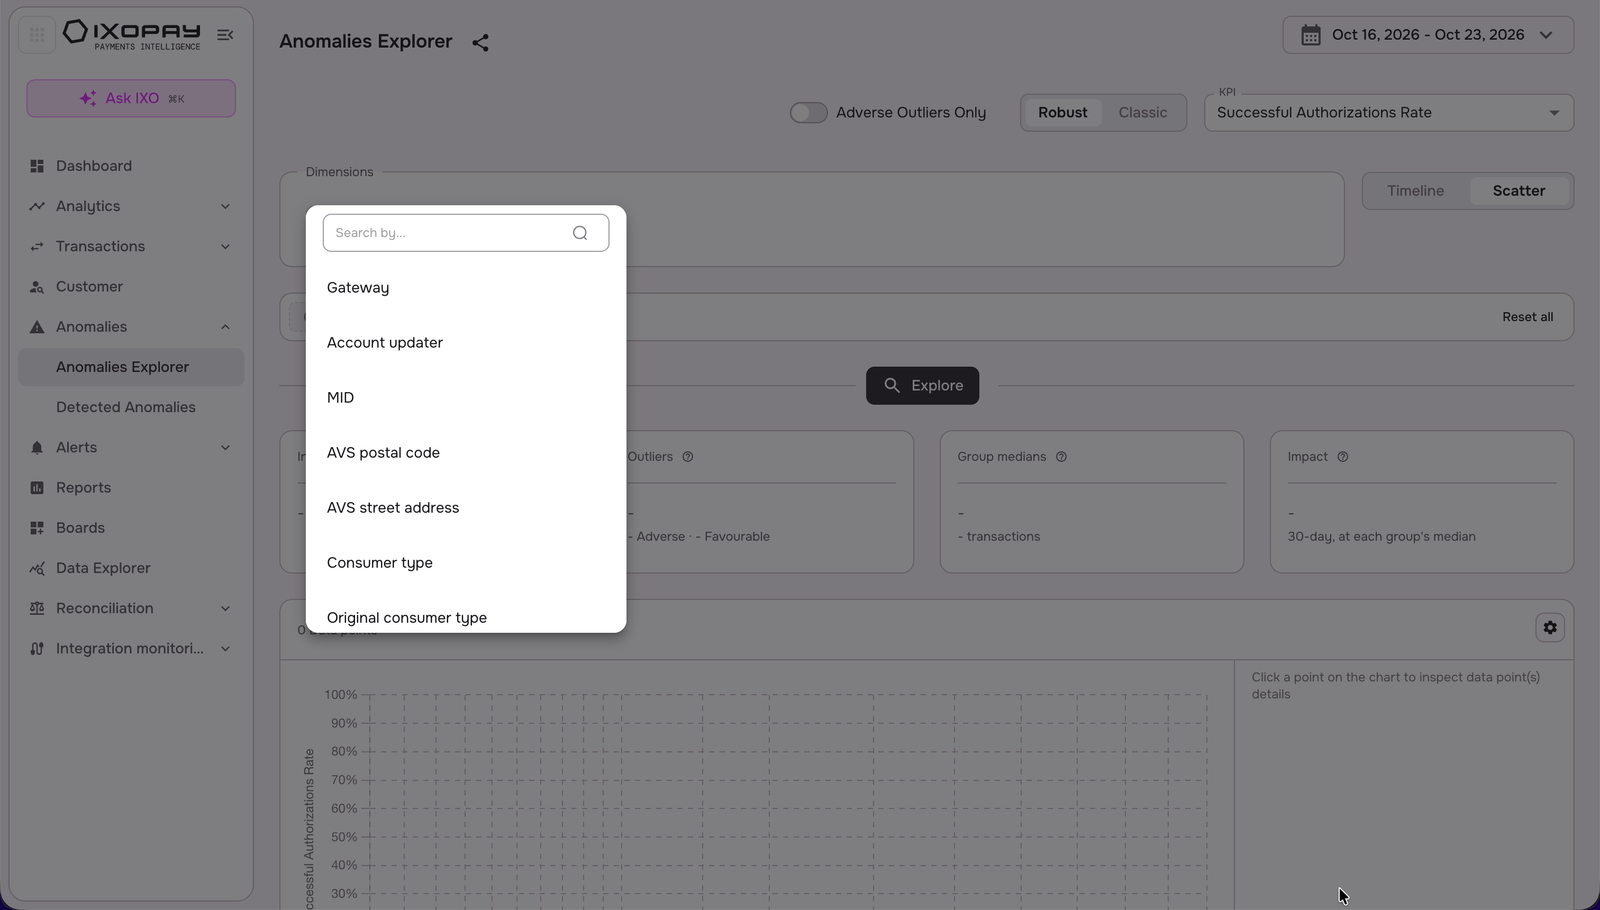
In the ‘Anomalies Explorer', you can define your target KPI (for e.g. 'Successful Authorization Rate’, etc.) and detect anomalies across multiple dimensions and filters as applicable to your payments data.
Choosing the baseline: Robust vs. Classic
The Robust / Classic toggle defines how the peer baseline is calculated:
- Robust - uses the Median of the KPI across all selected metrics/ dimensions in scope as the baseline. This is recommended, as a few extreme sub-dimensions do not shift the baseline.
- Classic - uses the Mean of the KPI across all selected metrics/ dimensions in scope as the baseline.
Switching the method recalculates the baseline, thresholds, outliers and impact.
Summary tiles
The tiles at the top of the page summarize the dimensions in scope for the selected KPI, timeframe and filters:
- In scope - number of sub-dimensions in scope as per the filtered groups.
- Outliers - number of under-performing (Adverse Outlier) or over-performing (Favourable Outlier) sub-dimensions in the filtered group.
- Group medians - the baseline, i.e. Median (Robust) or Mean (Classic) of the selected KPI across all in-scope dimensions, along with the total transactions considered.
- Impact - for outliers, the difference between the baseline and the actual KPI rate, weighted by volume, in your default currency.
Visualizing outliers
The chart plots every unique dimension value in scope as a data point, with the transaction count on the x-axis and the selected KPI on the y-axis. The size of each bubble reflects the dimension's volume, and the colour reflects its classification - Adverse Outlier (red), Favourable Outlier (green) or Normal (blue).
The dashed line shows the baseline (Median), the shaded band shows the Spread around it, and the dotted lines mark the boundaries of the Typical range. Dimension values falling outside the Typical range are flagged as outliers.
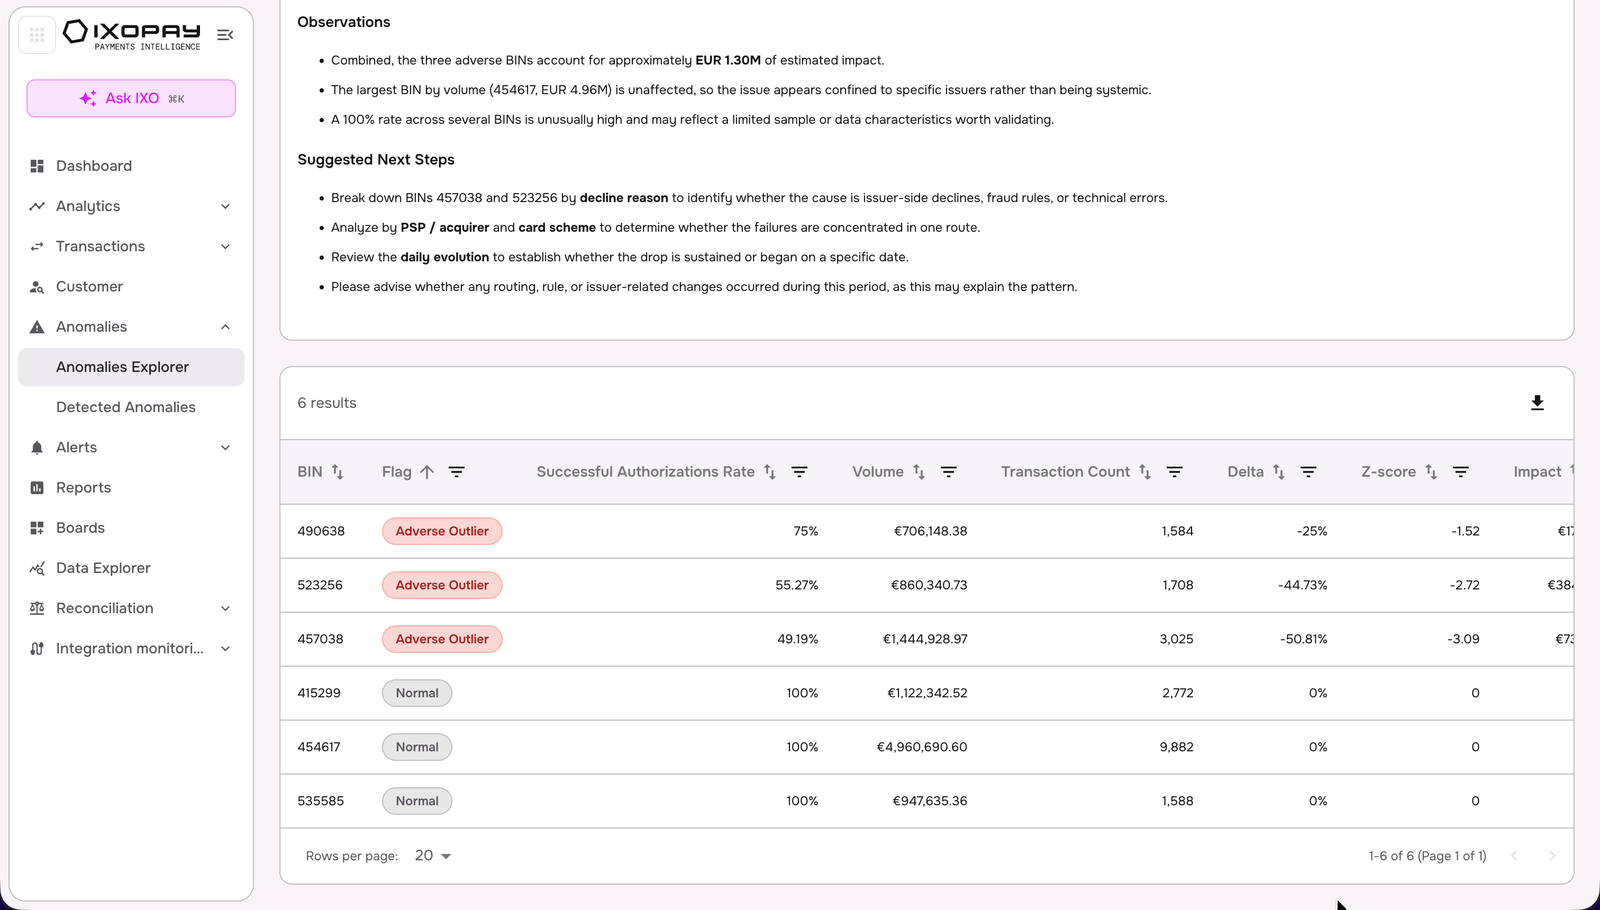
Click on any data point to inspect its details in the side panel, i.e. the dimension data (for e.g. BIN), its flag, KPI value, Volume, Count, Impact, Delta and Z-score.
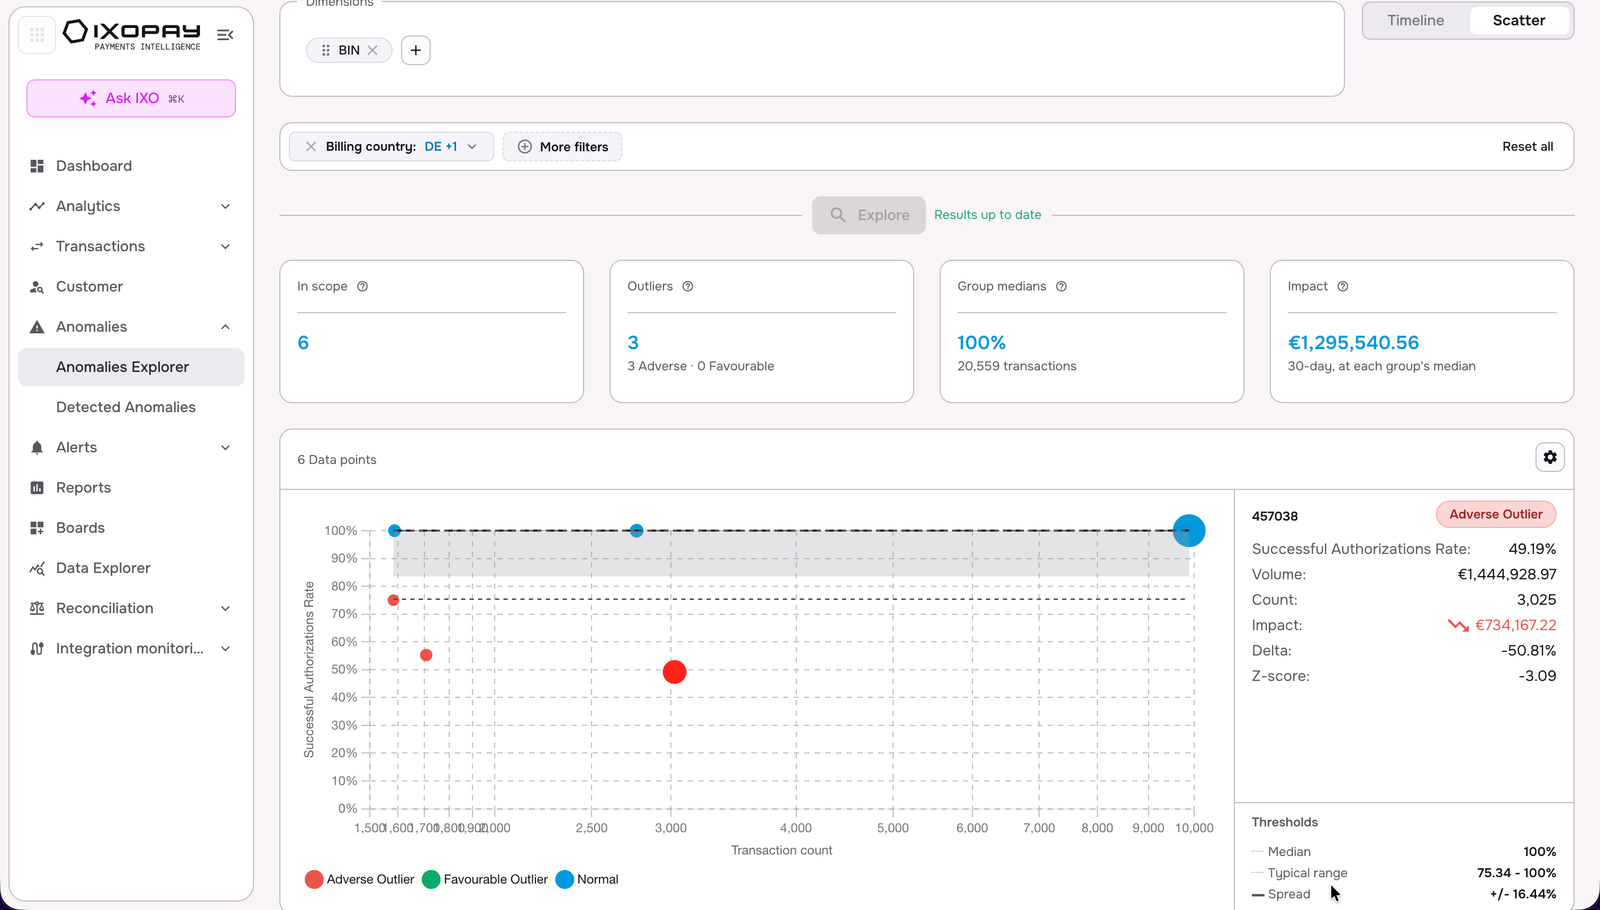
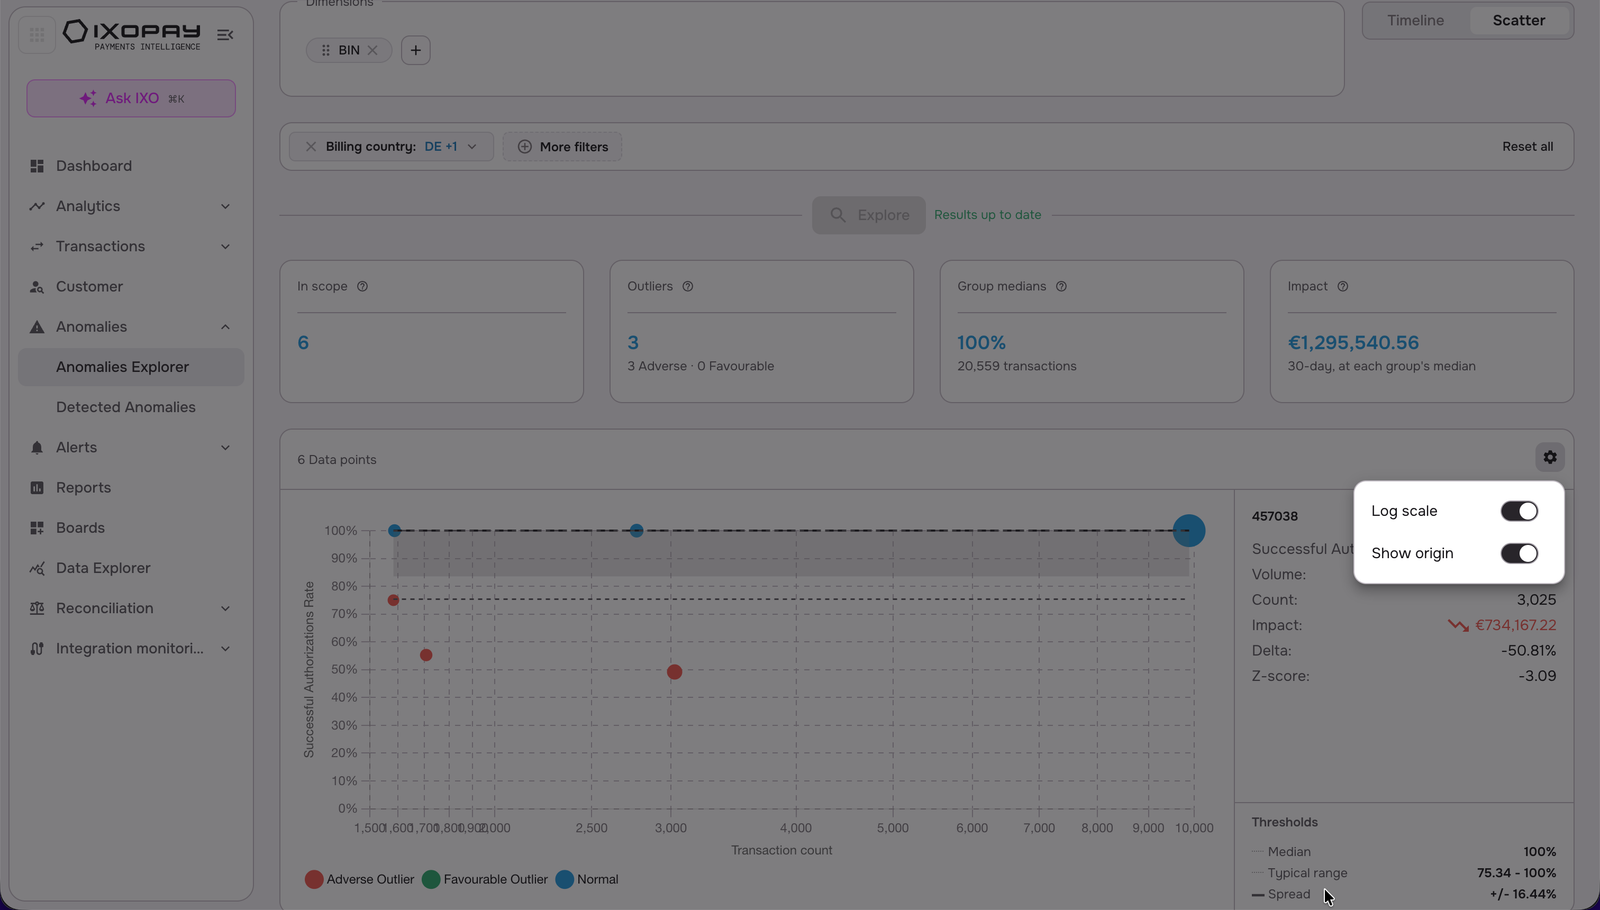
You can zoom into an area of the chart by scrolling on it, and reset the view with the reset-zoom button on the top right of the chart. Via the Chart settings (gear icon), you can switch the Log scale of the x-axis and Show origin of the y-axis on or off.
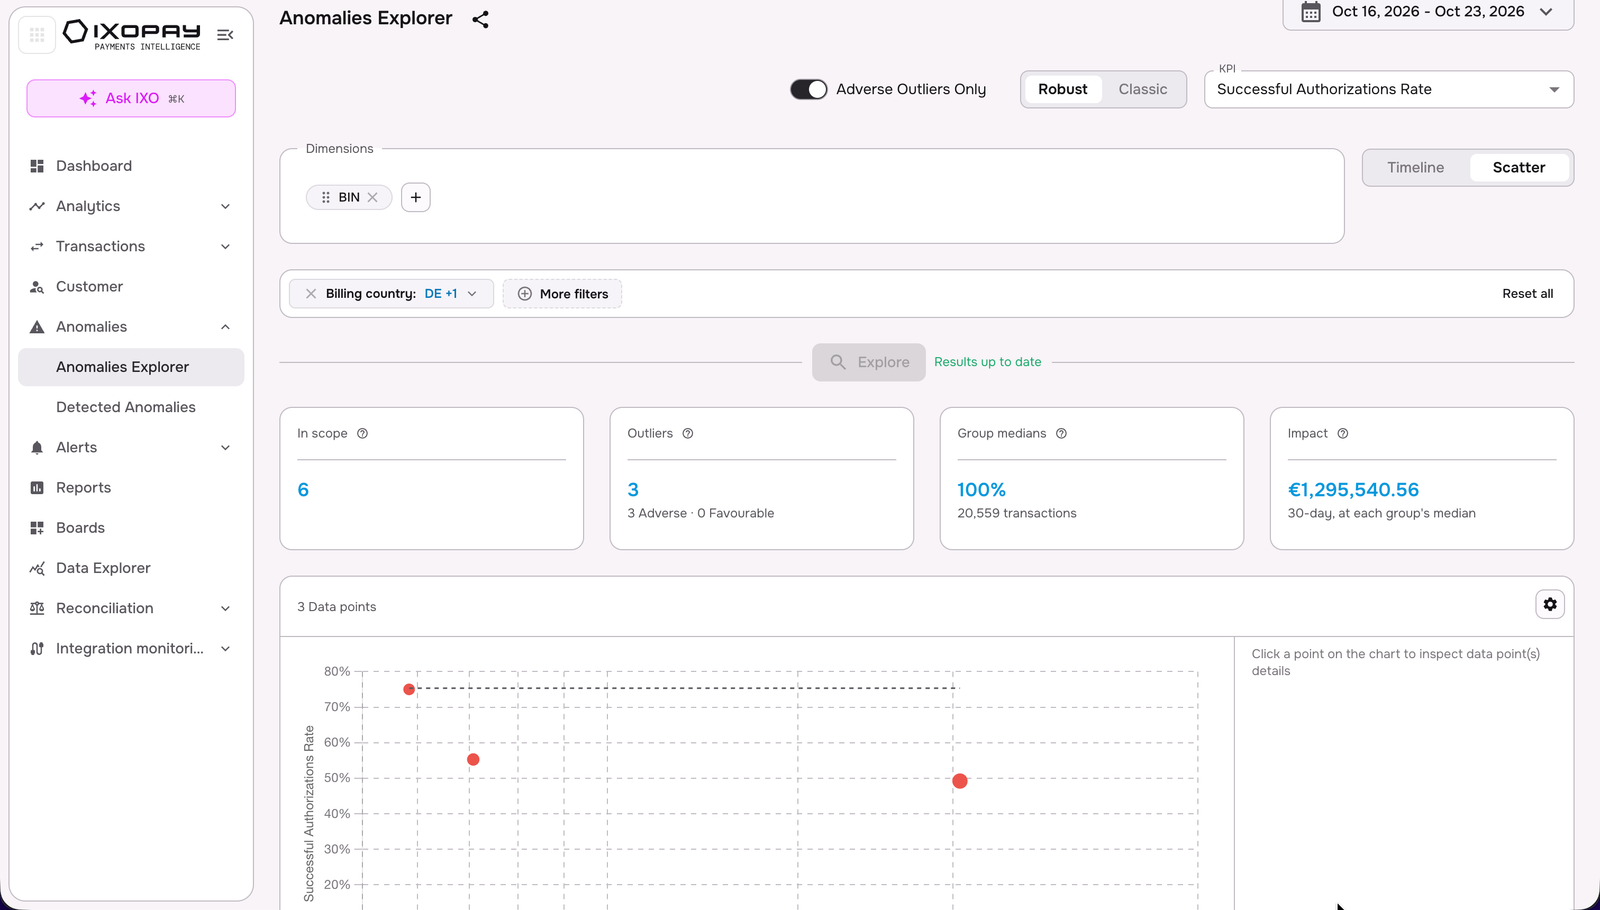
To focus only on the outliers that need your attention, enable Adverse Outliers Only, which limits the chart and table to the under-performing dimension values.
Analyse with IXO AI
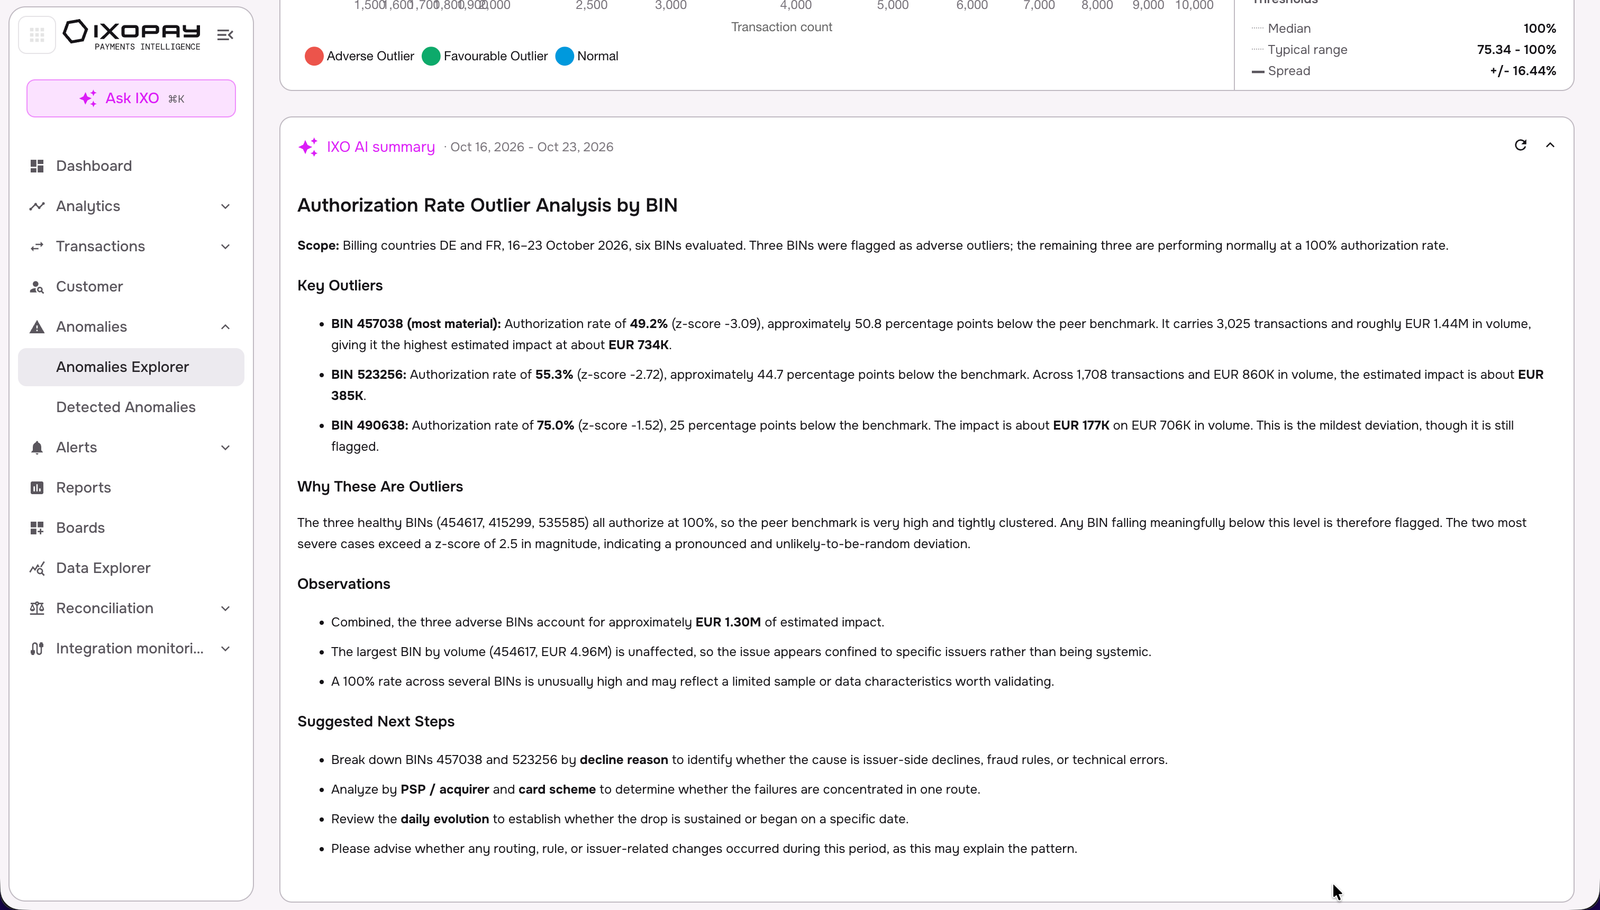
With a single click on Ask IXO in the IXO AI summary panel, IXO AI will analyse and summarize the group outliers for the selected timeframe - highlighting the most severe and most costly dimension values, the aggregate impact, and contextual notes and recommendations to explore the root cause further (e.g. a breakdown by PSP or issuing country). You can regenerate or collapse the summary with the icons on the top right of the panel.
Results table
Below the chart, the results table lists every dimension in scope with its Flag, KPI value, Volume, Transaction Count, Delta, Z-score and Impact. You can sort and filter each column, change the rows per page, and export the results for local storage in CSV format using the download icon.
Terminology
| Term | Description |
|---|---|
| Baseline | The Median (Robust) or Mean (Classic) of the selected KPI across all dimensions in scope, shown as Group medians and Median in Thresholds. |
| Spread | The typical dispersion of the KPI around the baseline (± value), shown as the shaded band on the chart. |
| Typical range | The range of KPI values considered normal for the grouped dimensions in scope (approx. baseline ± 1.5 × Spread). Dimension-groups outside this range are flagged as outliers. |
| Adverse Outlier | A dimensional group performing significantly worse than the baseline for the selected KPI. |
| Favourable Outlier | A dimensional group performing significantly better than the baseline for the selected KPI. |
| Normal | A dimensional group within the Typical range. |
| Delta | The difference between the KPI value and the baseline, in percentage points. |
| Z-score | The Delta expressed in units of Spread; the further from 0, the stronger the deviation. |
| Volume | The total transaction volume of the dimension in your default currency. |
| Transaction Count | The number of transactions processed for that dimensional group in the selected timeframe. |
| Impact | For outliers, the volume impact of the gap between the KPI value and the baseline, in your default currency. |